OPEN-SOURCE SCRIPT
Stock Valuation Models - Professional Investment Analysis Tool
📊 Overview
Stock Valuation Models is a comprehensive financial analysis indicator that combines multiple valuation methodologies to calculate intrinsic stock value. This professional-grade tool implements 7 different valuation methods, risk assessment framework, and financial health metrics to provide data-driven investment decisions.
🎯 Key Features
📈 Multiple Valuation Methods
🏥 Financial Health Metrics
⚖️ Risk Assessment Framework
🔍 Data Quality System
⚙️ Settings & Parameters
Main Settings
Valuation Methods
Additional Metrics
🔧 How It Works
Dynamic Calculations
Risk-Adjusted Analysis
Visual Display
📈 Interpretation Guide
💎 Intrinsic Value Results
🎯 Margin of Safety
⚖️ Risk Assessment
📊 Recommendations
🎓 Educational Tooltips
Every parameter includes detailed explanations accessible by hovering over the setting. Learn about:
💡 Best Practices
🚀 For Growth Stocks
💰 For Value Stocks
📈 For Dividend Stocks
⚠️ For Distressed Situations
⚠️ Important Notes & Data Limitations
🔧 Technical Limitations
💡 Best Practice Recommendations
🔗 Methodology
Based on established academic research and professional practices:
This indicator is designed for educational and analytical purposes. Always conduct additional research and consider consulting with financial professionals before making investment decisions.
Stock Valuation Models is a comprehensive financial analysis indicator that combines multiple valuation methodologies to calculate intrinsic stock value. This professional-grade tool implements 7 different valuation methods, risk assessment framework, and financial health metrics to provide data-driven investment decisions.
🎯 Key Features
📈 Multiple Valuation Methods
- Graham's Valuation - Conservative asset-based approach by Benjamin Graham
- Multiples Valuation - Market-based P/E and P/B ratios from sector peers
- Discounted Cash Flow (DCF) - Future cash flow projections with present value calculation
- Dividend Discount Model - Gordon Growth Model for dividend-paying stocks
- FCFF Model - Enterprise-level Free Cash Flow to Firm analysis
- EVA Model - Economic Value Added measurement above cost of capital
- Advanced Multiples - Enterprise Value ratios (EV/EBITDA, EV/Sales)
🏥 Financial Health Metrics
- Altman Z-Score - Bankruptcy prediction and financial distress assessment
- Piotroski F-Score - 9-point fundamental strength evaluation
- Beneish M-Score - Earnings manipulation detection system
- Magic Formula - Joel Greenblatt's combined quality and value scoring
⚖️ Risk Assessment Framework
- Multi-Factor Risk Scoring - Fundamental, market, quality, and data quality risks
- Risk-Adjusted Margin of Safety - Dynamic safety thresholds based on risk level
- Position Sizing Guidance - Risk-appropriate investment allocation recommendations
🔍 Data Quality System
- Real-Time Quality Tracking - Visual warnings for insufficient data
- Fallback Methodology - Alternative calculations when primary data unavailable
- Confidence Scoring - Method agreement and data quality assessment
⚙️ Settings & Parameters
Main Settings
- Margin of Safety (%) - Minimum discount required before buying (Default: 15%)
- Table Font Size - Choose between "Small" and "Normal" text size
Valuation Methods
- Graham's Valuation - Best for mature, stable companies with strong fundamentals
- Multiples Valuation - Compares to industry peers using dynamic sector ratios
- Discounted Cash Flow - Ideal for growth companies with predictable cash flows
- Dividend Discount Model - For consistent dividend-paying stocks (disabled by default)
- FCFF Model - Enterprise approach for leveraged companies and M&A analysis
- EVA Model - Measures value creation above cost of capital
- Advanced Multiples - Wall Street standard EV ratios for professional analysis
Additional Metrics
- Magic Formula - Combined quality and value scoring system
- Altman Z-Score - Bankruptcy risk assessment (Safe >2.99, Distress <1.81)
- Piotroski F-Score - Fundamental quality score (Excellent ≥8, Poor <4)
- Beneish M-Score - Manipulation detector (High Risk >-2.22, Low Risk ≤-2.22)
🔧 How It Works
Dynamic Calculations
- Sector-Based Ratios - Automatically detects company sector and applies appropriate valuation multiples
- Economic Integration - Uses real-time risk-free rates, VIX volatility, and GDP growth data
- Quality Weighting - Adjusts method weights based on company type (growth/mature/distressed) and market conditions
- Negative Value Handling - Shows actual calculated values but excludes negative results from weighted average
Risk-Adjusted Analysis
- VIX Integration - Higher market volatility increases required margin of safety
- Sector Risk Premiums - Energy and Financial sectors get higher risk multipliers
- Quality Adjustments - High Piotroski F-Score companies get lower risk ratings
- Data Quality Impact - Insufficient data increases risk score and safety requirements
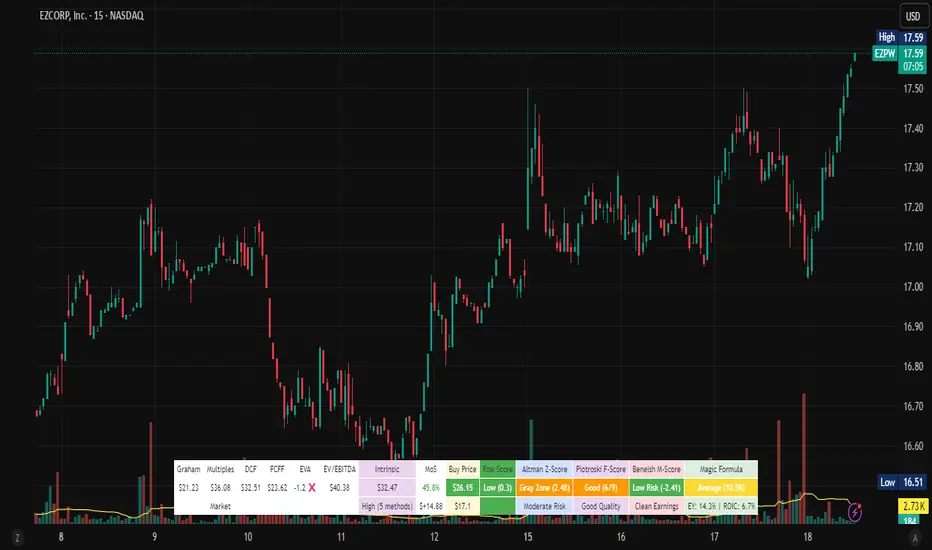
Visual Display
- Horizontal Table Layout - Organized by method groups (Valuation → Results → Risk → Health)
- Color-Coded Results - Green/Yellow/Red indicators for risk levels and recommendations
- Warning Symbols - ⚠️ for data quality issues, ❌ for excluded negative values
- Dollar Amounts - Both percentage and dollar-based margin of safety calculations
📈 Interpretation Guide
💎 Intrinsic Value Results
- Weighted Average - Combines all enabled methods based on intelligent weighting
- Confidence Level - High/Medium/Low based on method agreement and data quality
- Method Count - Number of successful valuation calculations
🎯 Margin of Safety
- Percentage - Current discount/premium to calculated intrinsic value
- Dollar Amount - Absolute dollar difference per share
- Buy Price - Risk-adjusted target purchase price
⚖️ Risk Assessment
- Low Risk (Green) - Normal position sizing (3-5%)
- Medium Risk (Yellow) - Reduced position sizing (1-3%)
- High Risk (Red) - Minimal position sizing (<1%)
📊 Recommendations
- STRONG BUY - Low risk + adequate margin + high confidence
- BUY - Meets risk-adjusted margin requirements
- HOLD - Positive margin but higher risk
- SELL - Insufficient margin for risk level
🎓 Educational Tooltips
Every parameter includes detailed explanations accessible by hovering over the setting. Learn about:
- When to use each valuation method
- How different metrics are calculated
- Interpretation thresholds and ratings
- Risk factors and quality indicators
💡 Best Practices
🚀 For Growth Stocks
- Enable DCF and Advanced Multiples
- Focus on Piotroski F-Score for quality assessment
- Use higher margin of safety due to volatility
💰 For Value Stocks
- Enable Graham's and Multiples Valuation
- Check Altman Z-Score for financial stability
- Consider Magic Formula rating
📈 For Dividend Stocks
- Enable Dividend Discount Model
- Focus on sustainable dividend coverage
- Check for consistent dividend history
⚠️ For Distressed Situations
- Prioritize Graham's asset-based approach
- Monitor Altman Z-Score closely
- Use higher risk-adjusted margins
⚠️ Important Notes & Data Limitations
📅 Data Timing Considerations
Fundamental Data Lag - Company financial data (earnings, cash flows, balance sheet items) may be 1-3 months behind current market conditions
Quarterly Reporting Delays - Most recent available data reflects the company's situation as of the last filed quarterly/annual report
Market vs. Fundamentals Gap - Stock prices react instantly to news, while fundamental data updates occur periodically
Accuracy Impact - Recent business changes, market events, or company developments may not be reflected in current calculations
🔧 Technical Limitations
- Data Dependencies - Requires fundamental data availability from TradingView
- Quality Warnings - Pay attention to ⚠️ symbols indicating insufficient data
- Risk Context - Always consider risk score in investment decisions
- Market Conditions - Tool automatically adjusts for market volatility (VIX)
- Sector Specificity - Ratios automatically adjust based on company's sector
💡 Best Practice Recommendations
- Supplement with Current Analysis - Always combine with recent news, earnings calls, and management guidance
- Monitor Data Quality - Check when the underlying financial data was last updated
- Consider Market Context - Factor in recent market events that may affect company performance
- Use as Starting Point - Treat calculations as baseline analysis requiring additional research
🔗 Methodology
Based on established academic research and professional practices:
- Benjamin Graham - Security Analysis principles
- Joel Greenblatt - Magic Formula methodology
- Edward Altman - Z-Score bankruptcy prediction
- Joseph Piotroski - Fundamental analysis scoring
- Messod Beneish - Earnings manipulation detection
- Modern Portfolio Theory - Risk-adjusted decision making
This indicator is designed for educational and analytical purposes. Always conduct additional research and consider consulting with financial professionals before making investment decisions.
開源腳本
秉持TradingView一貫精神,這個腳本的創作者將其設為開源,以便交易者檢視並驗證其功能。向作者致敬!您可以免費使用此腳本,但請注意,重新發佈代碼需遵守我們的社群規範。
免責聲明
這些資訊和出版物並非旨在提供,也不構成TradingView提供或認可的任何形式的財務、投資、交易或其他類型的建議或推薦。請閱讀使用條款以了解更多資訊。
開源腳本
秉持TradingView一貫精神,這個腳本的創作者將其設為開源,以便交易者檢視並驗證其功能。向作者致敬!您可以免費使用此腳本,但請注意,重新發佈代碼需遵守我們的社群規範。
免責聲明
這些資訊和出版物並非旨在提供,也不構成TradingView提供或認可的任何形式的財務、投資、交易或其他類型的建議或推薦。請閱讀使用條款以了解更多資訊。