OPEN-SOURCE SCRIPT
已更新 SL - 4 EMAs, 2 SMAs & Crossover Signals
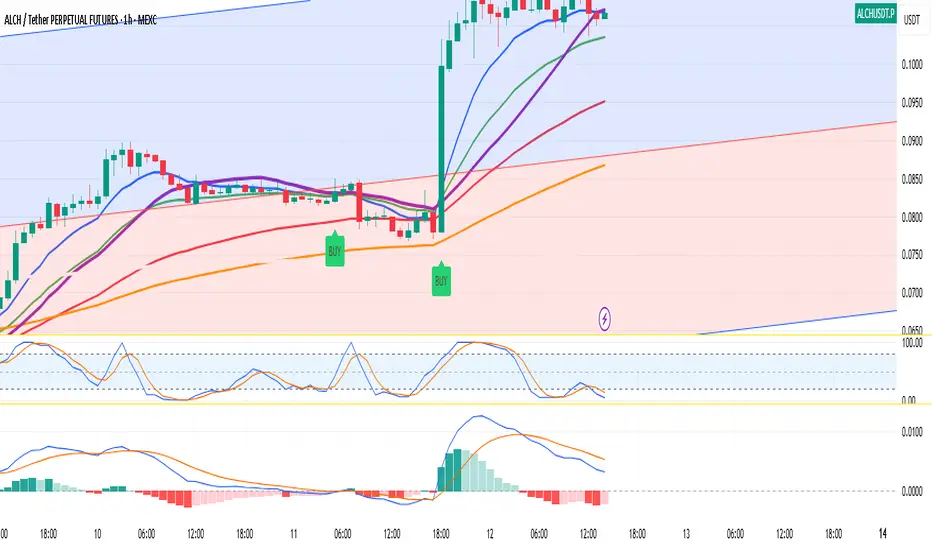
This TradingView Pine Script code is built for day traders, especially those trading crypto on a 1‑hour chart. In simple words, the script does the following:
Calculates Moving Averages:
It computes four exponential moving averages (EMAs) and two simple moving averages (SMAs) based on the closing price (or any price you select). Each moving average uses a different time period that you can adjust.
Plots Them on Your Chart:
The EMAs and SMAs are drawn on your chart in different colors and line thicknesses. This helps you quickly see the short-term and long-term trends.
Generates Buy and Sell Signals:
Buy Signal: When the fastest EMA (for example, a 10-period EMA) crosses above a slightly slower EMA (like a 21-period EMA) and the four EMAs are in a bullish order (meaning the fastest is above the next ones), the script will show a "BUY" label on the chart.
Sell Signal: When the fastest EMA crosses below the second fastest EMA and the four EMAs are lined up in a bearish order (the fastest is below the others), it displays a "SELL" label.
In essence, the code is designed to help you spot potential entry and exit points based on the relationships between multiple moving averages, which work as trend indicators. This makes it easier to decide when to trade on your 1‑hour crypto chart.
發行說明
update v2開源腳本
秉持TradingView一貫精神,這個腳本的創作者將其設為開源,以便交易者檢視並驗證其功能。向作者致敬!您可以免費使用此腳本,但請注意,重新發佈代碼需遵守我們的社群規範。
免責聲明
這些資訊和出版物並非旨在提供,也不構成TradingView提供或認可的任何形式的財務、投資、交易或其他類型的建議或推薦。請閱讀使用條款以了解更多資訊。
開源腳本
秉持TradingView一貫精神,這個腳本的創作者將其設為開源,以便交易者檢視並驗證其功能。向作者致敬!您可以免費使用此腳本,但請注意,重新發佈代碼需遵守我們的社群規範。
免責聲明
這些資訊和出版物並非旨在提供,也不構成TradingView提供或認可的任何形式的財務、投資、交易或其他類型的建議或推薦。請閱讀使用條款以了解更多資訊。