PROTECTED SOURCE SCRIPT
已更新 Dynamic Structure Overlay [AlgoXcalibur]
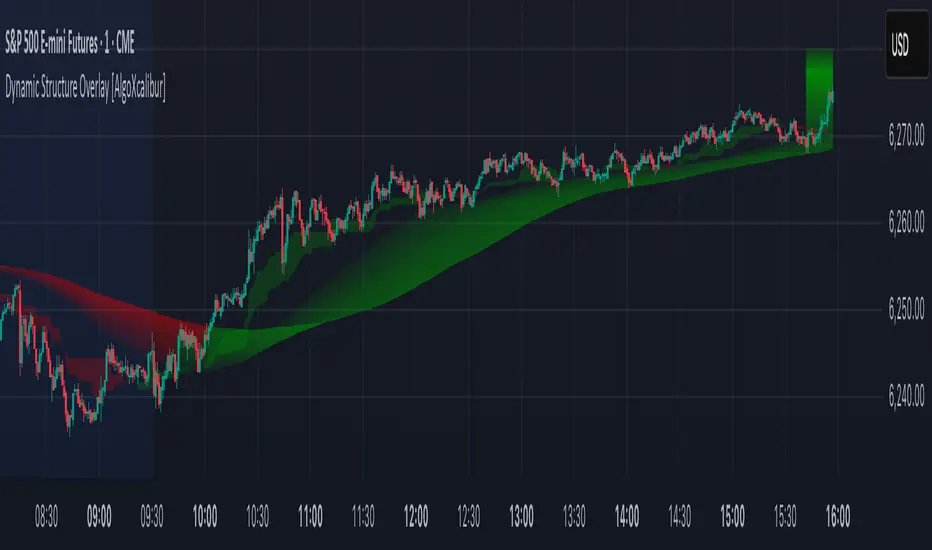
Dynamic Structure Overlay combines an ultra-dynamic Ribbon, adaptive supply/demand Zones, and a versatile momentum-based Cloud to paint a stunning picture of market structure. Whether you're riding strong trends or patiently analyzing consolidation, this tool helps visualize factors that influence trend direction and price movement.
📊 Indicator Components and Functions
This indicator integrates three core elements to provide an intuitive analysis of trend and market structure. Each component can be independently enabled or disabled to suit your preferences.
• Dynamic Ribbon
At the center of attention is the Dynamic Ribbon, which uses multi-layered moving averages rendered as a flowing ribbon with adaptive color gradients. It reacts to price action in real time, revealing trend direction, strength, and periods of expansion or compression.
• Dynamic Zones
These volume-weighted supply and demand zones are derived from price-to-volume deviations relative to VWAP. These zones often guide price action during strong trends.
• Dynamic Cloud
A unique momentum-based structure derived from dynamic price ranges by averaging the highs and lows from recent price action. The Cloud captures momentum strength and directional pressure, providing a visual guide to trend continuations and transitions.
Together, these components form a comprehensive overlay that adapts in real time to changing market conditions.
🚀 Ride the Trend
Dynamic Structure Overlay is a multi-dimensional tool — its framework helps visualize dynamic factors that often influence price action, assisting traders in staying aligned with the evolving trend.
發行說明
Update: Enhanced color brightness and transparency受保護腳本
此腳本以閉源形式發佈。 不過,您可以自由使用,沒有任何限制 — 點擊此處了解更多。
免責聲明
這些資訊和出版物並非旨在提供,也不構成TradingView提供或認可的任何形式的財務、投資、交易或其他類型的建議或推薦。請閱讀使用條款以了解更多資訊。
受保護腳本
此腳本以閉源形式發佈。 不過,您可以自由使用,沒有任何限制 — 點擊此處了解更多。
免責聲明
這些資訊和出版物並非旨在提供,也不構成TradingView提供或認可的任何形式的財務、投資、交易或其他類型的建議或推薦。請閱讀使用條款以了解更多資訊。