OPEN-SOURCE SCRIPT
已更新 Elliott Wave Oscillator + TTM Squeeze
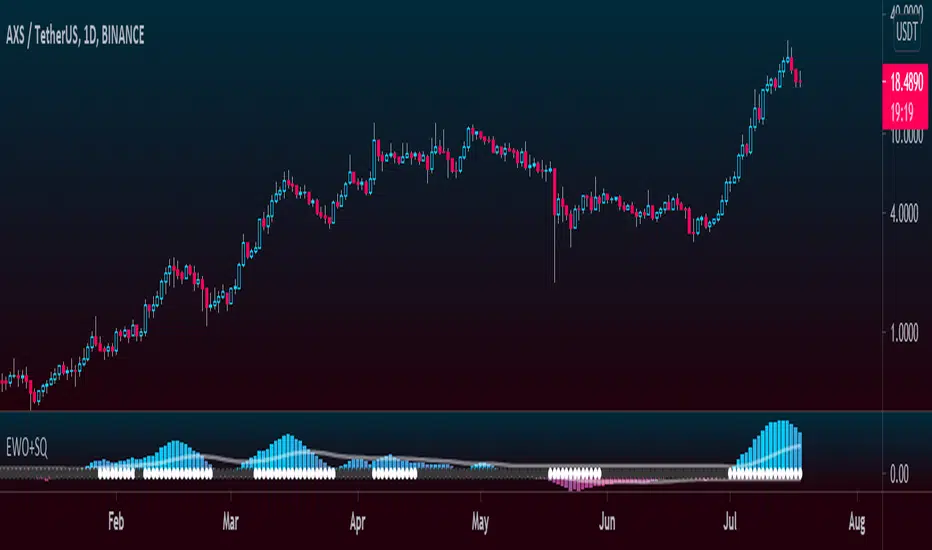
The Elliott Wave Oscillator enables traders to track Elliott Wave counts and divergences. It allows traders to observe when an existing wave ends and when a new one begins. It works on the basis of a simple calculation: The difference between a 5-period simple moving average and a 34-period simple moving average.
Included with the EWO are the breakout bands that help identify strong impulses.
To further aid in the detection of explosive movements I've included the TTM Squeeze indicator which shows the relationship between Keltner Channels & Bollinger Bands, wich highlight situations of compression/low volatility, and expansion/high volatility. The dark dots indicate a squeeze, and white dots indicates the end of such squeeze and therefore the start of an expansion.
Enjoy!
發行說明
Added the options to choose the color of the Breakout Bands and the color of the squeeze indicator.發行說明
Zero line color setting added.開源腳本
秉持TradingView一貫精神,這個腳本的創作者將其設為開源,以便交易者檢視並驗證其功能。向作者致敬!您可以免費使用此腳本,但請注意,重新發佈代碼需遵守我們的社群規範。
@FractalTrade_
免責聲明
這些資訊和出版物並非旨在提供,也不構成TradingView提供或認可的任何形式的財務、投資、交易或其他類型的建議或推薦。請閱讀使用條款以了解更多資訊。
開源腳本
秉持TradingView一貫精神,這個腳本的創作者將其設為開源,以便交易者檢視並驗證其功能。向作者致敬!您可以免費使用此腳本,但請注意,重新發佈代碼需遵守我們的社群規範。
@FractalTrade_
免責聲明
這些資訊和出版物並非旨在提供,也不構成TradingView提供或認可的任何形式的財務、投資、交易或其他類型的建議或推薦。請閱讀使用條款以了解更多資訊。