OPEN-SOURCE SCRIPT
HL BREAKOUT
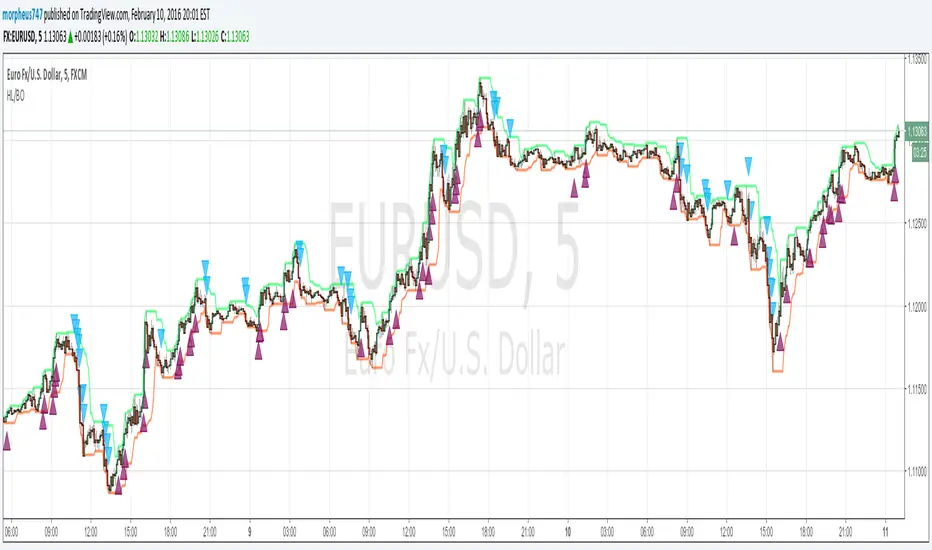
The base of the indicator is the breakout of historic High and lows.
There are 3 basic configurations
1° The High length that measure the latest 10 bars and make the "higher high"
2° The Low length taht measure the latest 10 bars and make the "lower low"
3° The Breakout PIPs administrator that defines how much pips are needed from the latest higher high to be defined as a level breakout.
So the strategy is super easy. The indicators show you the 10...20.. or whatever you need old bars high and lows.
When a breakout of that levels occurs and the candle "close" above or below and the close are more than "X" amount of PIPs a marker show up. The marker are the signals of buy and sell
I test some configurations, and work in all timeframes but.
I suggest
10, 10, 0.0003 for timeframes from 1m to 15m
and 10, 10, 0.0005 for timeframes higher than 15m
Maybe you need to test other configurations for 4h 1 day, etc the basics are the same in all timeframes, the main difference is the amount of pips that will be considered as "breakout" the higher timeframe the higher amount you need to prevent false positives.
Last words: 0.000X are for the PIPs for currencies that have 4 or 5 decimals like euro and other, if you use in YEN change it to a configuration of 2 digits decimal. Just that.
Have "fun" !
開源腳本
本著TradingView的真正精神,此腳本的創建者將其開源,以便交易者可以查看和驗證其功能。向作者致敬!雖然您可以免費使用它,但請記住,重新發佈程式碼必須遵守我們的網站規則。
免責聲明
這些資訊和出版物並不意味著也不構成TradingView提供或認可的金融、投資、交易或其他類型的意見或建議。請在使用條款閱讀更多資訊。
開源腳本
本著TradingView的真正精神,此腳本的創建者將其開源,以便交易者可以查看和驗證其功能。向作者致敬!雖然您可以免費使用它,但請記住,重新發佈程式碼必須遵守我們的網站規則。
免責聲明
這些資訊和出版物並不意味著也不構成TradingView提供或認可的金融、投資、交易或其他類型的意見或建議。請在使用條款閱讀更多資訊。