INVITE-ONLY SCRIPT
Smart Money Oscillator
Smart Money Oscillator
Class: oscillator
Purpose: intraday
Period: 15 min – 1 hour
Idea of the Indicator
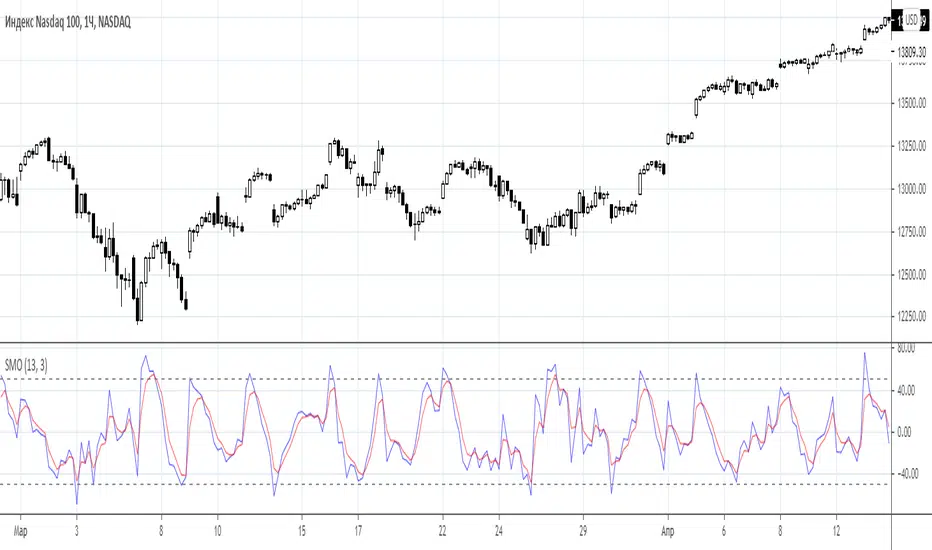
Smart Money Oscillator is the next step in evolution of oscillators. It uses regression analysis technics to calculate the theoretical price of the asset and compare it with the actual price. This price difference is used to define whether current prices are overbought or oversold.
“Smart Money Oscillator” is very volatile and provide much more signals than traditional oscillators like RSI or Stochastic. It can be used for active trading in volatile assets like Nasdaq index.
Structure of the Indicator
Indicator consists of two oscillatory lines: main (blue colored) and signal (red colored). Overbought and oversold zones are indicated with black dotted horizontal lines.
Rules of trading
Rules of trading are typical for oscillators.
• When the oscillatory line enters the overbought zone – long positions should be closed and after line reversal short position should be opened.
• When the oscillatory line enters the oversold zone – short positions should be closed and after line reversal long position should be opened.
Signal line is used to reduce the level of noise in the oscillatory line dynamics.
Access to the indicator
Please address all questions about this indicator (including access to it) in private messages.
Class: oscillator
Purpose: intraday
Period: 15 min – 1 hour
Idea of the Indicator
Smart Money Oscillator is the next step in evolution of oscillators. It uses regression analysis technics to calculate the theoretical price of the asset and compare it with the actual price. This price difference is used to define whether current prices are overbought or oversold.
“Smart Money Oscillator” is very volatile and provide much more signals than traditional oscillators like RSI or Stochastic. It can be used for active trading in volatile assets like Nasdaq index.
Structure of the Indicator
Indicator consists of two oscillatory lines: main (blue colored) and signal (red colored). Overbought and oversold zones are indicated with black dotted horizontal lines.
Rules of trading
Rules of trading are typical for oscillators.
• When the oscillatory line enters the overbought zone – long positions should be closed and after line reversal short position should be opened.
• When the oscillatory line enters the oversold zone – short positions should be closed and after line reversal long position should be opened.
Signal line is used to reduce the level of noise in the oscillatory line dynamics.
Access to the indicator
Please address all questions about this indicator (including access to it) in private messages.
Авторские индикаторы
bit.ly/2oBvkHY
Больше информации на нашем ютьюб-канале
youtube.com/channel/UCYEOurJfasXWyYnrriGwsqQ
bit.ly/2oBvkHY
Больше информации на нашем ютьюб-канале
youtube.com/channel/UCYEOurJfasXWyYnrriGwsqQ
僅限邀請腳本
僅限作者授權的用戶訪問此腳本,並且通常需要付費。您可以將其增加到收藏腳本中,但是只有在向作者請求並獲得許可之後,才能使用它。 請聯繫Trade24Fx以了解更多信息,或按照下面作者的說明進行操作。
TradingView 不建議購買並使用此腳本,除非您 100% 信任其作者並了解腳本的工作原理。在許多情況下,您可以在我們的社群腳本中免費找到良好的開源替代方案。
作者的說明
″Please address all questions about this indicator (including access to it) in private messages.
想在圖表上使用此腳本?
警告:請閱讀,然後再請求訪問權限。
Авторские индикаторы
bit.ly/2oBvkHY
Больше информации на нашем ютьюб-канале
youtube.com/channel/UCYEOurJfasXWyYnrriGwsqQ
bit.ly/2oBvkHY
Больше информации на нашем ютьюб-канале
youtube.com/channel/UCYEOurJfasXWyYnrriGwsqQ
免責聲明
這些資訊和出版物並不意味著也不構成TradingView提供或認可的金融、投資、交易或其他類型的意見或建議。請在使用條款閱讀更多資訊。