OPEN-SOURCE SCRIPT
已更新 Day Range EU/Rome 00:00-22:30 - live + storico (colori)
# Day Range EU/Rome 00:00–22:30 — live + historical (colors)
**What it does**
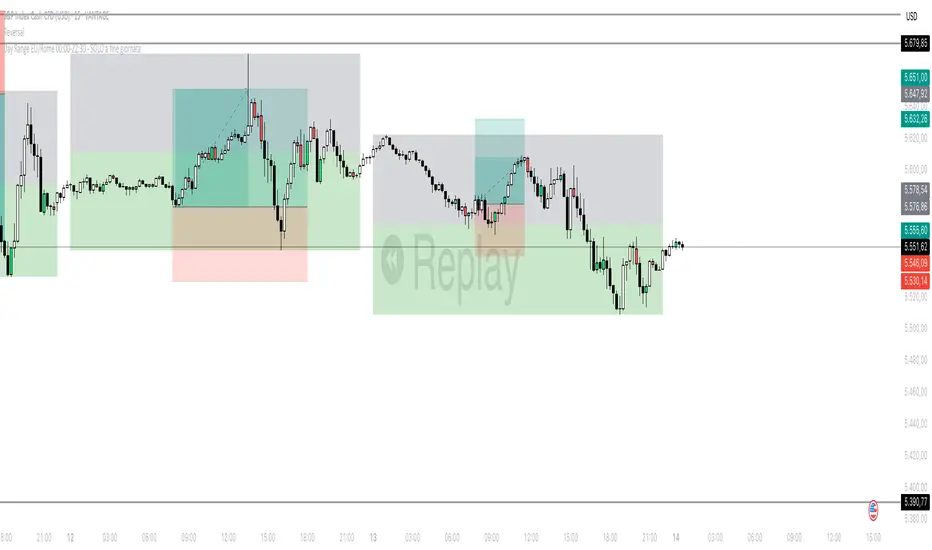
Draws, for each day (timezone **Europe/Rome**), a rectangle that contains the **high** and **low** recorded between **00:00** and **22:30**.
* During the day it creates a **live box** that updates bar by bar (it extends to the latest candle).
* At the end of the session (after 22:30) it saves a **fixed historical box** for that day.
* The rectangle is **split horizontally**: half **top** and half **bottom** (customizable colors).
* Boxes are **anchored in time** (*xloc = bar\_time*): they don’t “slide” when you zoom or pan the chart.
* Works on **intraday** timeframes (recommended **15m**; also fine on 5m, 30m, 1h).
* Includes **all days**, **Friday included**.
---
## How it works
* The code detects the **00:00 → 22:30 (Europe/Rome)** session with `time("0000-2230","Europe/Rome")`.
* Within that window it continuously updates the day’s **High/Low**.
* When the **session closes** it creates two historical boxes (upper and lower halves) using the **H/L** of the day that just ended.
* The current day’s box remains **live** and follows the chart until 22:30.
**What it does**
Draws, for each day (timezone **Europe/Rome**), a rectangle that contains the **high** and **low** recorded between **00:00** and **22:30**.
* During the day it creates a **live box** that updates bar by bar (it extends to the latest candle).
* At the end of the session (after 22:30) it saves a **fixed historical box** for that day.
* The rectangle is **split horizontally**: half **top** and half **bottom** (customizable colors).
* Boxes are **anchored in time** (*xloc = bar\_time*): they don’t “slide” when you zoom or pan the chart.
* Works on **intraday** timeframes (recommended **15m**; also fine on 5m, 30m, 1h).
* Includes **all days**, **Friday included**.
---
## How it works
* The code detects the **00:00 → 22:30 (Europe/Rome)** session with `time("0000-2230","Europe/Rome")`.
* Within that window it continuously updates the day’s **High/Low**.
* When the **session closes** it creates two historical boxes (upper and lower halves) using the **H/L** of the day that just ended.
* The current day’s box remains **live** and follows the chart until 22:30.
發行說明
# Day Range EU/Rome 00:00–22:30 — live + historical (colors)**What it does**
Draws, for each day (timezone **Europe/Rome**), a rectangle that contains the **high** and **low** recorded between **00:00** and **22:30**.
* During the day it creates a **live box** that updates bar by bar (it extends to the latest candle).
* At the end of the session (after 22:30) it saves a **fixed historical box** for that day.
* The rectangle is **split horizontally**: half **top** and half **bottom** (customizable colors).
* Boxes are **anchored in time** (*xloc = bar\_time*): they don’t “slide” when you zoom or pan the chart.
* Works on **intraday** timeframes (recommended **15m**; also fine on 5m, 30m, 1h).
* Includes **all days**, **Friday included**.
---
## How it works
* The code detects the **00:00 → 22:30 (Europe/Rome)** session with `time("0000-2230","Europe/Rome")`.
* Within that window it continuously updates the day’s **High/Low**.
* When the **session closes** it creates two historical boxes (upper and lower halves) using the **H/L** of the day that just ended.
* The current day’s box remains **live** and follows the chart until 22:30.
開源腳本
秉持TradingView一貫精神,這個腳本的創作者將其設為開源,以便交易者檢視並驗證其功能。向作者致敬!您可以免費使用此腳本,但請注意,重新發佈代碼需遵守我們的社群規範。
免責聲明
這些資訊和出版物並非旨在提供,也不構成TradingView提供或認可的任何形式的財務、投資、交易或其他類型的建議或推薦。請閱讀使用條款以了解更多資訊。
開源腳本
秉持TradingView一貫精神,這個腳本的創作者將其設為開源,以便交易者檢視並驗證其功能。向作者致敬!您可以免費使用此腳本,但請注意,重新發佈代碼需遵守我們的社群規範。
免責聲明
這些資訊和出版物並非旨在提供,也不構成TradingView提供或認可的任何形式的財務、投資、交易或其他類型的建議或推薦。請閱讀使用條款以了解更多資訊。