OPEN-SOURCE SCRIPT
已更新 Niteya BG Candle Formations
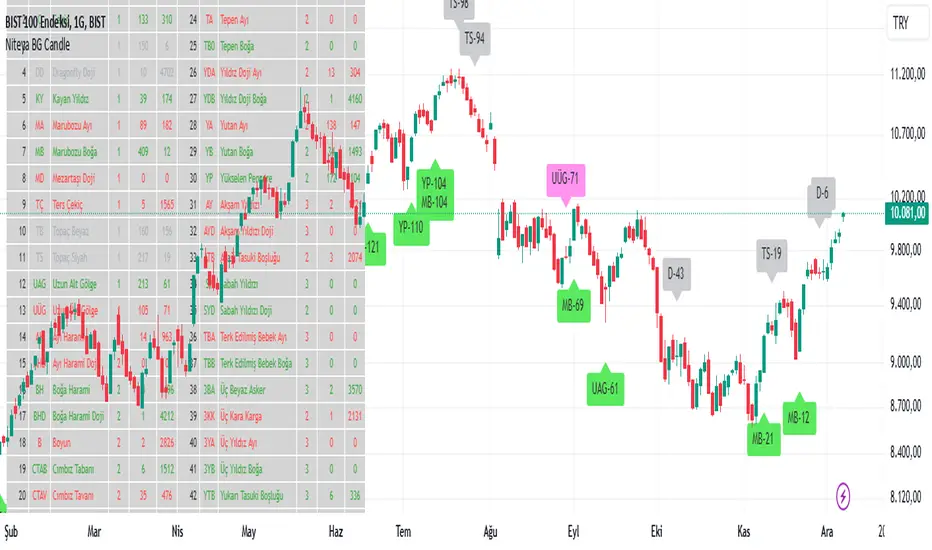
Niteya BG Candle Formations is an indicator that shows the total number of formations of each of the 44 different candlestick formations and the index of the last bar it was formed in a table and on a chart.
It shows candlestick formations that express uptrends and downtrends and indecisive market conditions in different colors.
The table columns contain the values shown below:
S.No: Candlestick formation bar index number
Code: Candlestick formation abbreviation
Formation: Name of the candlestick formation
Quantity: Number of candles in the formation
Total: Total number of formations on the chart
Last: Index of the last formation on the chart
bilgigunlugum.net/public/images/borsa/candlef_1.png
Details
bilgigunlugum.net/borsa/pine_script/pine_script_indicator/candlef
Türkçe açıklaması
Niteya BG Candle Formations, toplam 44 adet farklı mum formasyonunun her birinin toplam oluşma sayısını ve en son oluştuğu barın endeksini bir tabloda ve grafik üzerinde gösteren bir indikatördür.
Yükseliş ve düşüş trendleri ile kararsız piyasa durumlarını ifade eden mum formasyonlarını farklı renkte gösterir.
Tablo sütunları aşağıda gösterilen değerleri içerir:
S.No: Mum formasyonu sıra numarası
Kod: Mum formasyonu kısaltması
Formasyonu: Mum formasyonunun adı
Adet: Formasyonu oluşturan mum sayısı
Toplam: Grafikte gerçekleşen toplam formasyon sayısı
Son: Grafikte gerçekleşen en son formasyon endeksi
bilgigunlugum.net/public/images/borsa/candlef_1.png
Detaylar
bilgigunlugum.net/borsa/pine_script/pine_script_indicator/candlef
發行說明
Table and character sizes have been reduced.開源腳本
秉持TradingView一貫精神,這個腳本的創作者將其設為開源,以便交易者檢視並驗證其功能。向作者致敬!您可以免費使用此腳本,但請注意,重新發佈代碼需遵守我們的社群規範。
免責聲明
這些資訊和出版物並非旨在提供,也不構成TradingView提供或認可的任何形式的財務、投資、交易或其他類型的建議或推薦。請閱讀使用條款以了解更多資訊。
免責聲明
這些資訊和出版物並非旨在提供,也不構成TradingView提供或認可的任何形式的財務、投資、交易或其他類型的建議或推薦。請閱讀使用條款以了解更多資訊。