OPEN-SOURCE SCRIPT
已更新 Pi Cycle Oscillator
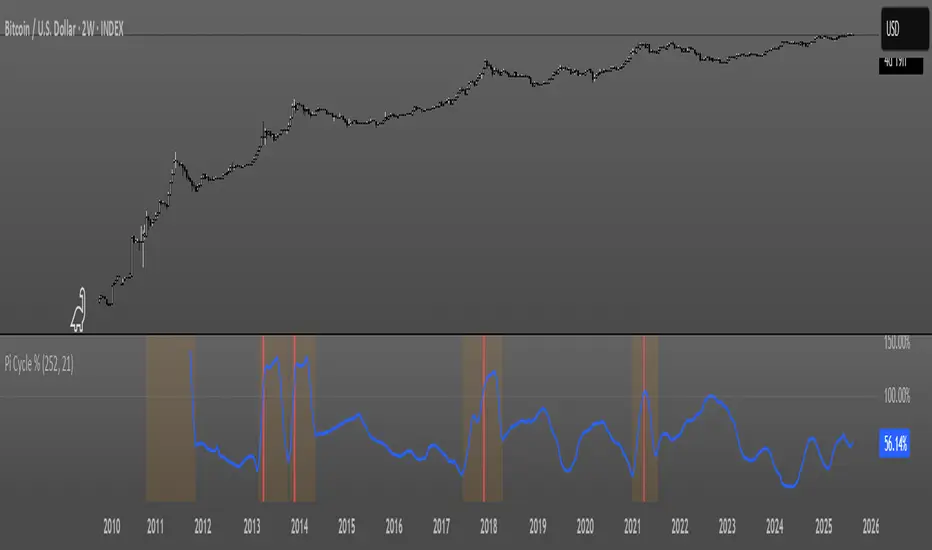
This oscillator combines the Pi Cycle Top indicator with a percentile-based approach to create a more precise and easy to read market timing tool.
Instead of waiting for moving average crossovers, it shows you exactly how close you are to a potential market top.
Orange background means you should start preparing for a potential top and look into taking profits.
Red background means that the crossover has happened on the original Pi Cycle Indicator and that you should have already sold everything. (Crossover of the gray line aka 100)
Thank you
Bollinger Band Width Percentile - The_Caretaker
Pi Cycle Top - megasyl20
發行說明
Changed signal line from 100 -> 99Advise usage in 1W or lower.
發行說明
Red background needs "movingTarget > 0"發行說明
Added the ability to pick between searching for tops or bottoms.開源腳本
秉持TradingView一貫精神,這個腳本的創作者將其設為開源,以便交易者檢視並驗證其功能。向作者致敬!您可以免費使用此腳本,但請注意,重新發佈代碼需遵守我們的社群規範。
免責聲明
這些資訊和出版物並非旨在提供,也不構成TradingView提供或認可的任何形式的財務、投資、交易或其他類型的建議或推薦。請閱讀使用條款以了解更多資訊。
免責聲明
這些資訊和出版物並非旨在提供,也不構成TradingView提供或認可的任何形式的財務、投資、交易或其他類型的建議或推薦。請閱讀使用條款以了解更多資訊。