OPEN-SOURCE SCRIPT
已更新 VEMA_LTF
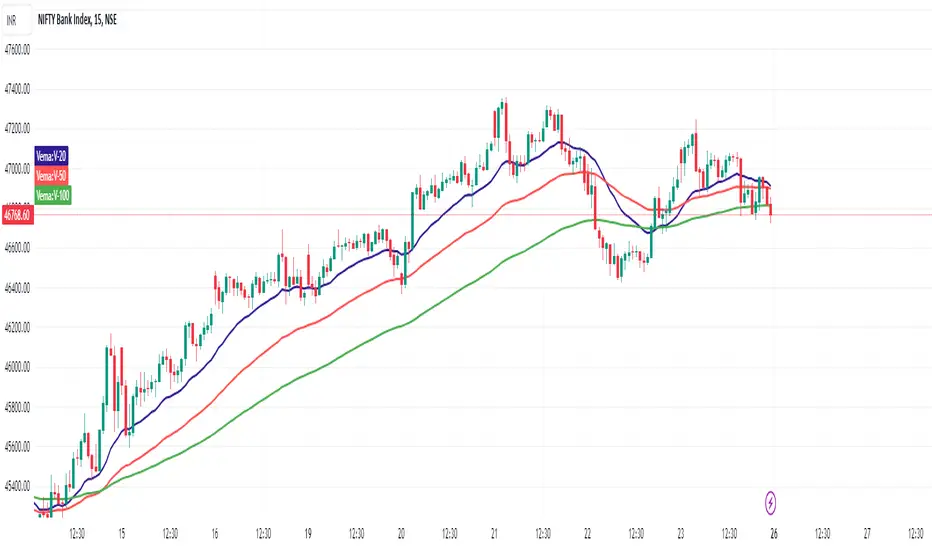
VEMA indicator is based on lower time frame volume data and it has 3 lines.
20, 50, 100 moving averages of the close price in each candle with the highest volume.
Effectively working fine and hence sharing.
Will Add more information with examples in next update
20, 50, 100 moving averages of the close price in each candle with the highest volume.
Effectively working fine and hence sharing.
Will Add more information with examples in next update
發行說明
The script changed from a default 10-second time frame to 1-minute time frame. In case our subscription to TV supports sec based time frame - please set it to 10 sec.
In general observation on any time frame:
If the price crosses all three lines and closes above or below 20-VEMA, we can see good movement in the same direction in short period of time.
Analyze more charts with different time frames along with your favorite indicator and VEMA lines.
發行說明
Minor correction as per coding guidelines開源腳本
秉持TradingView一貫精神,這個腳本的創作者將其設為開源,以便交易者檢視並驗證其功能。向作者致敬!您可以免費使用此腳本,但請注意,重新發佈代碼需遵守我們的社群規範。
免責聲明
這些資訊和出版物並非旨在提供,也不構成TradingView提供或認可的任何形式的財務、投資、交易或其他類型的建議或推薦。請閱讀使用條款以了解更多資訊。
免責聲明
這些資訊和出版物並非旨在提供,也不構成TradingView提供或認可的任何形式的財務、投資、交易或其他類型的建議或推薦。請閱讀使用條款以了解更多資訊。