OPEN-SOURCE SCRIPT
52W CP/H & H/L with percentage % differences
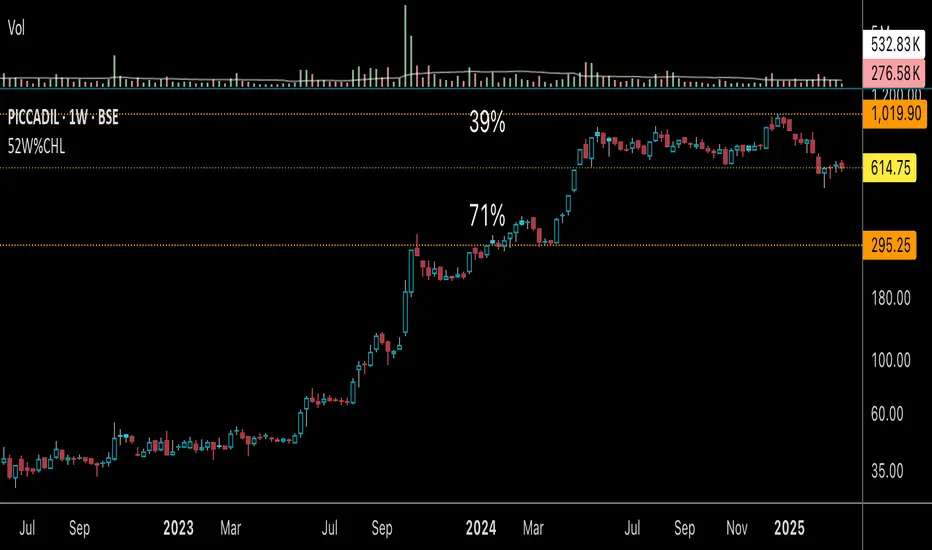
52 Week High/Low Indicator with percentage difference between High/Low & High/Current Price
A simple indicator that can be used on any timeframe to display the 52 week High/Low values along with percentage differences (rounded) between High/Low & High/Current Price to get an idea of the strength in the instruments current price to it's 52 week journey.
Features
* Works on any timeframe.
* Simple horizontal lines showing only the current 52 week values.
* Allows the user to select whether to calculate the 52-week values from candle close values or the respective highs/lows.
* Allows users to toggle percentages label on/off
This script is open source for users to refine as per their needs. Additionally I would appreciate any constructive feedback. Thank you
開源腳本
秉持TradingView一貫精神,這個腳本的創作者將其設為開源,以便交易者檢視並驗證其功能。向作者致敬!您可以免費使用此腳本,但請注意,重新發佈代碼需遵守我們的社群規範。
免責聲明
這些資訊和出版物並非旨在提供,也不構成TradingView提供或認可的任何形式的財務、投資、交易或其他類型的建議或推薦。請閱讀使用條款以了解更多資訊。
免責聲明
這些資訊和出版物並非旨在提供,也不構成TradingView提供或認可的任何形式的財務、投資、交易或其他類型的建議或推薦。請閱讀使用條款以了解更多資訊。