OPEN-SOURCE SCRIPT
Volatility % Bands (O→C)
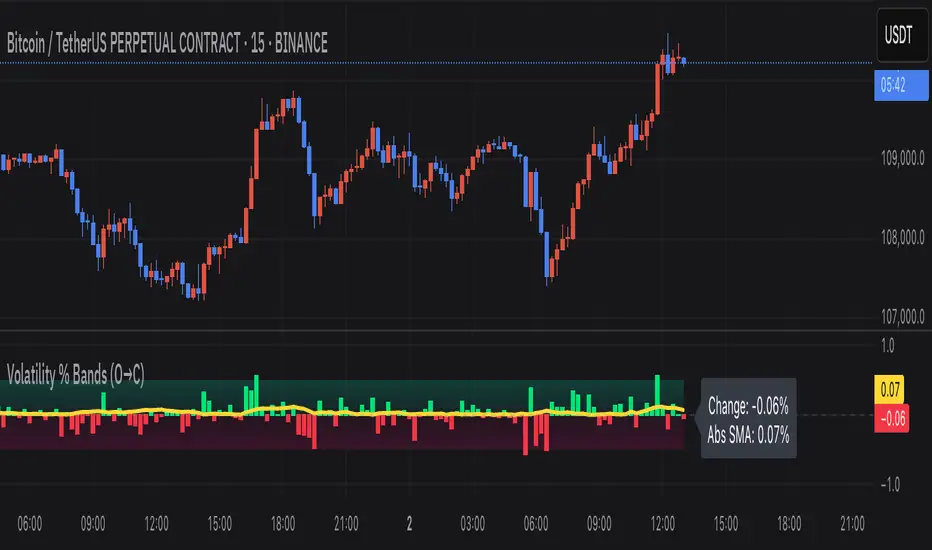
Volatility % Bands (O→C) is an indicator designed to visualize the percentage change from Open to Close of each candle, providing a clear view of short-term momentum and volatility.
This tool can be useful for volatility breakout strategies, day trading, and short-term momentum analysis.
- **Histogram**: Displays bar-by-bar % change (Close vs Open). Green bars indicate positive changes, while red bars indicate negative ones, making momentum shifts easy to identify.
- **Moving Average Line**: Plots the Simple Moving Average (SMA) of the absolute % change, helping traders track the average volatility over a chosen period.
- **Background Bands**: Based on the user-defined Level Step, ±1 to ±5 zones are highlighted as shaded bands, allowing quick recognition of whether volatility is low, moderate, or extreme.
- **Label**: Shows the latest candle’s % change and the current SMA value as a floating label on the right, making it convenient for real-time monitoring.
This tool can be useful for volatility breakout strategies, day trading, and short-term momentum analysis.
開源腳本
秉持TradingView一貫精神,這個腳本的創作者將其設為開源,以便交易者檢視並驗證其功能。向作者致敬!您可以免費使用此腳本,但請注意,重新發佈代碼需遵守我們的社群規範。
비트코인 선물 매매를 2년 정도 했으며, 수익 추구도 좋지만 시장 분석 자체를 즐겨하는 편입니다.
免責聲明
這些資訊和出版物並非旨在提供,也不構成TradingView提供或認可的任何形式的財務、投資、交易或其他類型的建議或推薦。請閱讀使用條款以了解更多資訊。
開源腳本
秉持TradingView一貫精神,這個腳本的創作者將其設為開源,以便交易者檢視並驗證其功能。向作者致敬!您可以免費使用此腳本,但請注意,重新發佈代碼需遵守我們的社群規範。
비트코인 선물 매매를 2년 정도 했으며, 수익 추구도 좋지만 시장 분석 자체를 즐겨하는 편입니다.
免責聲明
這些資訊和出版物並非旨在提供,也不構成TradingView提供或認可的任何形式的財務、投資、交易或其他類型的建議或推薦。請閱讀使用條款以了解更多資訊。