OPEN-SOURCE SCRIPT
Lucy – 3-Bar Reversal with EMA50 Trend Filter
📛 Lucy – 3-Bar Reversal with EMA50 Trend Filter
Purpose:
To detect and highlight bullish and bearish 3-bar reversal patterns on the chart, but only when they align with the dominant trend, defined by the EMA 50.
✅ How It Works
🟢 Bullish 3-Bar Reversal (Buy Setup):
Bar 1 is bearish (close < open)
Bar 2 makes a lower low than Bar 1
Bar 3 is bullish (close > open) and closes above Bar 2’s high
Price must be above EMA 50 (trend filter)
✅ Result: Shows a green triangle below the bar
🔴 Bearish 3-Bar Reversal (Sell Setup):
Bar 1 is bullish (close > open)
Bar 2 makes a higher high than Bar 1
Bar 3 is bearish (close < open) and closes below Bar 2’s low
Price must be below EMA 50
✅ Result: Shows a red triangle above the bar
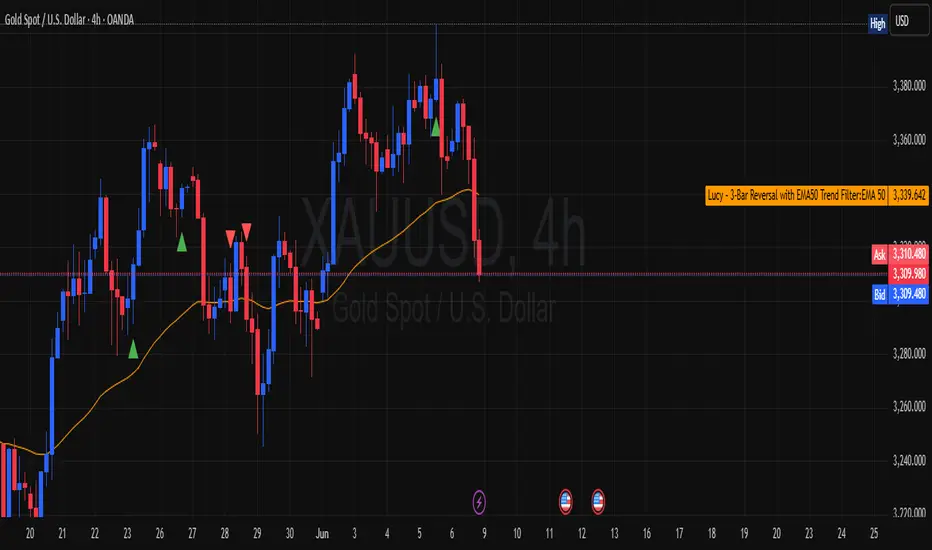
📊 What It Plots:
🔼 Green triangle below bullish signal bar
🔽 Red triangle above bearish signal bar
🟠 Orange line = EMA50 (trend filter)
🔔 Built-in Alerts:
You’ll get an alert if:
A bullish reversal pattern forms above EMA50
A bearish reversal pattern forms below EMA50
🧠 Use Cases:
Great for trend-following traders who want clean, price-action entries
Works well on intraday (15m/1h) or swing (4h/daily) timeframes
Can be used for manual entries, or converted to strategy for automation
Purpose:
To detect and highlight bullish and bearish 3-bar reversal patterns on the chart, but only when they align with the dominant trend, defined by the EMA 50.
✅ How It Works
🟢 Bullish 3-Bar Reversal (Buy Setup):
Bar 1 is bearish (close < open)
Bar 2 makes a lower low than Bar 1
Bar 3 is bullish (close > open) and closes above Bar 2’s high
Price must be above EMA 50 (trend filter)
✅ Result: Shows a green triangle below the bar
🔴 Bearish 3-Bar Reversal (Sell Setup):
Bar 1 is bullish (close > open)
Bar 2 makes a higher high than Bar 1
Bar 3 is bearish (close < open) and closes below Bar 2’s low
Price must be below EMA 50
✅ Result: Shows a red triangle above the bar
📊 What It Plots:
🔼 Green triangle below bullish signal bar
🔽 Red triangle above bearish signal bar
🟠 Orange line = EMA50 (trend filter)
🔔 Built-in Alerts:
You’ll get an alert if:
A bullish reversal pattern forms above EMA50
A bearish reversal pattern forms below EMA50
🧠 Use Cases:
Great for trend-following traders who want clean, price-action entries
Works well on intraday (15m/1h) or swing (4h/daily) timeframes
Can be used for manual entries, or converted to strategy for automation
開源腳本
秉持TradingView一貫精神,這個腳本的創作者將其設為開源,以便交易者檢視並驗證其功能。向作者致敬!您可以免費使用此腳本,但請注意,重新發佈代碼需遵守我們的社群規範。
免責聲明
這些資訊和出版物並非旨在提供,也不構成TradingView提供或認可的任何形式的財務、投資、交易或其他類型的建議或推薦。請閱讀使用條款以了解更多資訊。
開源腳本
秉持TradingView一貫精神,這個腳本的創作者將其設為開源,以便交易者檢視並驗證其功能。向作者致敬!您可以免費使用此腳本,但請注意,重新發佈代碼需遵守我們的社群規範。
免責聲明
這些資訊和出版物並非旨在提供,也不構成TradingView提供或認可的任何形式的財務、投資、交易或其他類型的建議或推薦。請閱讀使用條款以了解更多資訊。