OPEN-SOURCE SCRIPT
Strength/Weakness Indicator
The Strength/Weakness Indicator is a customisable tool designed to help traders identify key areas of market strength and weakness based on the 50% Fibonacci retracement level.
█ Underlying Concept:
The concept behind this indicator draws heavily on the principles of Fibonacci retracement and WD Gann’s market theories, particularly the importance of the 50% level in signalling critical psychological areas of support and resistance. Historically, the 50% retracement level has been regarded as a key marker where markets either find new buyers/sellers or continue a trend. Gann himself placed significant emphasis on the halfway point of a previous market move as a critical level for market strength and reversal.
█ Key Features:
1 — Multi-Timeframe Fibonacci Analysis:
2 — Dynamic Strength/Weakness Labelling:
3 — Customizable Visual Representation:
4 — Cross-Timeframe Validation:
5 — Strategic Decision-Making Aid:
█ How It Works:
1 — Defining Custom Timeframes:
2 — Calculating Strength/Weakness:
3 — Comparing Multiple Timeframes:
█ How to Use:
1 — Assess Market Conditions:
2 — Plan Entries/Exits:
3 — Cross-Timeframe Analysis:
█ Why This Indicator is Unique:
Disclaimer: This script is for educational purposes and is not financial advice. Trading involves significant risk, so please consult a professional advisor before making investment decisions. For the best results, use this indicator alongside other technical analysis methods like trend lines or moving averages to help you confirm signals and make more informed decisions.
█ Underlying Concept:
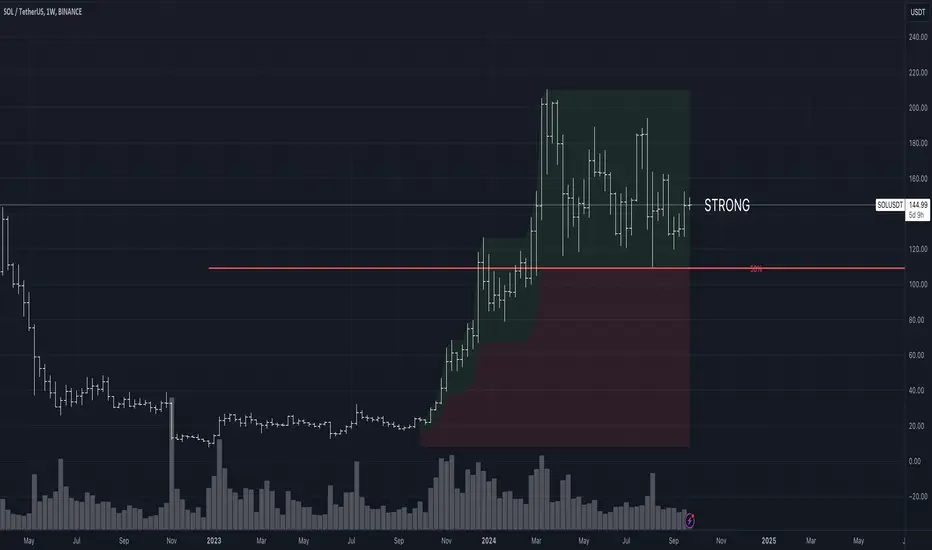
The concept behind this indicator draws heavily on the principles of Fibonacci retracement and WD Gann’s market theories, particularly the importance of the 50% level in signalling critical psychological areas of support and resistance. Historically, the 50% retracement level has been regarded as a key marker where markets either find new buyers/sellers or continue a trend. Gann himself placed significant emphasis on the halfway point of a previous market move as a critical level for market strength and reversal.
- Strength: When an asset is trading above the 50% retracement level, it suggests that buyers are in control and that the market is showing strength. This is particularly useful for traders aiming to ride the continuation of an uptrend.
- Weakness: Conversely, when the price falls below the 50% retracement level, it indicates that sellers are dominating, and the market is showing signs of weakness. This can be an early indication of a potential reversal or further decline.
█ Key Features:
1 — Multi-Timeframe Fibonacci Analysis:
- This indicator supports up to two distinct retracement levels, allowing traders to analyse multiple timeframes simultaneously. Customise the look-back periods for each level to track the highest high and lowest low over your chosen period.
- The tool is adaptable to short-term, swing trading, and long-term investing, making it useful across different trading styles.
2 — Dynamic Strength/Weakness Labelling:
- The script dynamically calculates and displays whether the asset is “STRONG” or “WEAK” based on its position relative to the 50% retracement levels. If the price is above both levels, it is considered "VERY STRONG." Conversely, trading below both levels signals "VERY WEAK" conditions. This real-time feedback helps traders gauge market sentiment with ease.
3 — Customizable Visual Representation:
- Both retracement levels are fully customisable, including line colours, styles, and thicknesses. The script offers custom background fills—highlighting areas of strength (green) and weakness (red)—to provide a clear visual aid for identifying key price zones.
- Traders can modify the appearance of text labels (size, colour, position) and choose whether to extend lines left, right, both directions, or not at all.
4 — Cross-Timeframe Validation:
- Traders can cross-reference price action between two timeframes to confirm trends. If both levels signal strength or weakness, it validates market momentum, increasing confidence in trade decisions.
5 — Strategic Decision-Making Aid:
- The indicator aids in identifying support and resistance zones based on the 50% retracement level. Use it to time entries and exits effectively: price above the 50% level suggests potential trend continuation, while falling below may indicate reversal.
█ How It Works:
1 — Defining Custom Timeframes:
- The trader selects custom time periods (days, weeks, months, or years) to calculate the highest high and lowest low, allowing precise control over the analysis.
2 — Calculating Strength/Weakness:
- Once the 50% retracement level is calculated, the price’s position relative to it determines the market’s condition. Above 50% signals strength, below signals weakness.
3 — Comparing Multiple Timeframes:
- Enable a second retracement level to compare different time periods. This feature is useful for spotting divergences between short-term and long-term trends or validating strength across timeframes.
█ How to Use:
1 — Assess Market Conditions:
- If price trades above both 50% retracement levels, it indicates strong bullish momentum. Conversely, trading below both levels signals bearish conditions.
2 — Plan Entries/Exits:
- Use the 50% level as a reference for support and resistance. Plan to enter when the price bounces off the 50% level, or exit if it breaks down below this critical level.
3 — Cross-Timeframe Analysis:
- Validate the market trend by comparing retracement levels across different timeframes. This helps in confirming whether the trend is strong enough to justify holding a position.
█ Why This Indicator is Unique:
- Comprehensive Multi-Timeframe Analysis: While most Fibonacci indicators focus on a single period, this tool provides a deeper understanding by allowing traders to compare price action across multiple timeframes.
- Customizable and Dynamic: The real-time strength/weakness labeling, customizable background fills, and the ability to analyze two retracement levels simultaneously make this tool adaptable to any trading strategy.
- Valuable for All Traders: Whether you are day trading, swing trading, or investing long-term, the Strength/Weakness Indicator offers clarity on key market levels and sentiment, improving decision-making for entries and exits.
Disclaimer: This script is for educational purposes and is not financial advice. Trading involves significant risk, so please consult a professional advisor before making investment decisions. For the best results, use this indicator alongside other technical analysis methods like trend lines or moving averages to help you confirm signals and make more informed decisions.
開源腳本
秉持TradingView一貫精神,這個腳本的創作者將其設為開源,以便交易者檢視並驗證其功能。向作者致敬!您可以免費使用此腳本,但請注意,重新發佈代碼需遵守我們的社群規範。
免責聲明
這些資訊和出版物並非旨在提供,也不構成TradingView提供或認可的任何形式的財務、投資、交易或其他類型的建議或推薦。請閱讀使用條款以了解更多資訊。
免責聲明
這些資訊和出版物並非旨在提供,也不構成TradingView提供或認可的任何形式的財務、投資、交易或其他類型的建議或推薦。請閱讀使用條款以了解更多資訊。