OPEN-SOURCE SCRIPT
Gann High Low Strategy
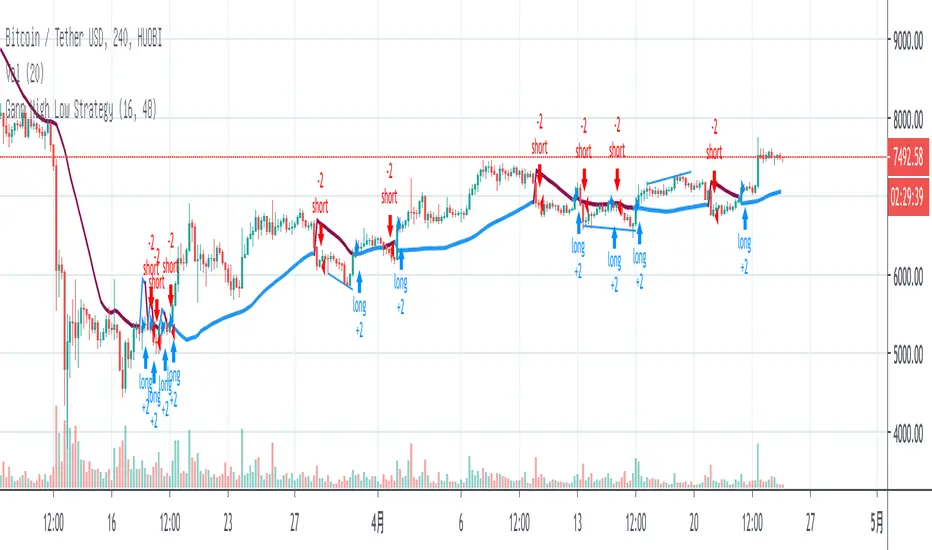
Gann High Low is a moving average based trend indicator consisting of two different simple moving averages.
The Gann High Low Activator Indicator was described by Robert Krausz in a 1998 issue of Stocks & Commodities Magazine. It is a simple moving average SMA of the previous n period's highs or lows.
The indicator tracks both curves (of the highs and the lows). The close of the bar defines which of the two gets plotted.
開源腳本
秉持TradingView一貫精神,這個腳本的創作者將其設為開源,以便交易者檢視並驗證其功能。向作者致敬!您可以免費使用此腳本,但請注意,重新發佈代碼需遵守我們的社群規範。
免責聲明
這些資訊和出版物並非旨在提供,也不構成TradingView提供或認可的任何形式的財務、投資、交易或其他類型的建議或推薦。請閱讀使用條款以了解更多資訊。
免責聲明
這些資訊和出版物並非旨在提供,也不構成TradingView提供或認可的任何形式的財務、投資、交易或其他類型的建議或推薦。請閱讀使用條款以了解更多資訊。