OPEN-SOURCE SCRIPT
Market Regime (w/ Adaptive Thresholds)
Logic Behind This Indicator
This indicator identifies market regimes (trending vs. mean-reverting) using adaptive thresholds that adjust to recent market conditions.
Core Components
1. Regime Score Calculation (0-100 scale)
Starts at 50 (neutral) and adjusts based on two factors:
A. Trend Strength
Compares fast EMA (5) vs. slow EMA (10)
If fast > slow by >1% → +60 points (strong uptrend)
If fast < slow by >1% → -60 points (strong downtrend)
B. RSI Momentum
Uses 7-period RSI smoothed with 3-period EMA
RSI > 70 → +20 points (overbought/trending)
RSI < 30 → -20 points (oversold/mean-reverting)
The score is then smoothed and clamped between 0-100.
2. Adaptive Thresholds
Instead of fixed levels, thresholds adjust to recent market behavior:
Looks back 100 bars to find the min/max regime score
High threshold = 80% of the range (trending regime)
Low threshold = 20% of the range (mean-reverting regime)
This prevents false signals in different volatility environments.
3. Regime Classification
Regime Score Classification Meaning
Above high threshold STRONG TREND Market is trending strongly (follow momentum)
Below low threshold STRONG MEAN REVERSION Market is choppy/oversold (fade moves)
Between thresholds NEUTRAL No clear regime (stay out or wait)
4. Regime Persistence Filter
Requires the regime to hold for a minimum number of bars (default: 1) before confirming
Prevents whipsaws from brief score fluctuations
What It Aims to Detect
Visual Cues
This indicator identifies market regimes (trending vs. mean-reverting) using adaptive thresholds that adjust to recent market conditions.
Core Components
1. Regime Score Calculation (0-100 scale)
Starts at 50 (neutral) and adjusts based on two factors:
A. Trend Strength
Compares fast EMA (5) vs. slow EMA (10)
If fast > slow by >1% → +60 points (strong uptrend)
If fast < slow by >1% → -60 points (strong downtrend)
B. RSI Momentum
Uses 7-period RSI smoothed with 3-period EMA
RSI > 70 → +20 points (overbought/trending)
RSI < 30 → -20 points (oversold/mean-reverting)
The score is then smoothed and clamped between 0-100.
2. Adaptive Thresholds
Instead of fixed levels, thresholds adjust to recent market behavior:
Looks back 100 bars to find the min/max regime score
High threshold = 80% of the range (trending regime)
Low threshold = 20% of the range (mean-reverting regime)
This prevents false signals in different volatility environments.
3. Regime Classification
Regime Score Classification Meaning
Above high threshold STRONG TREND Market is trending strongly (follow momentum)
Below low threshold STRONG MEAN REVERSION Market is choppy/oversold (fade moves)
Between thresholds NEUTRAL No clear regime (stay out or wait)
4. Regime Persistence Filter
Requires the regime to hold for a minimum number of bars (default: 1) before confirming
Prevents whipsaws from brief score fluctuations
What It Aims to Detect
- When to use trend-following strategies (green = buy breakouts, ride momentum)
- When to use mean-reversion strategies (red = buy dips, sell rallies)
- When to stay out (gray = unclear conditions, high risk of false signals)
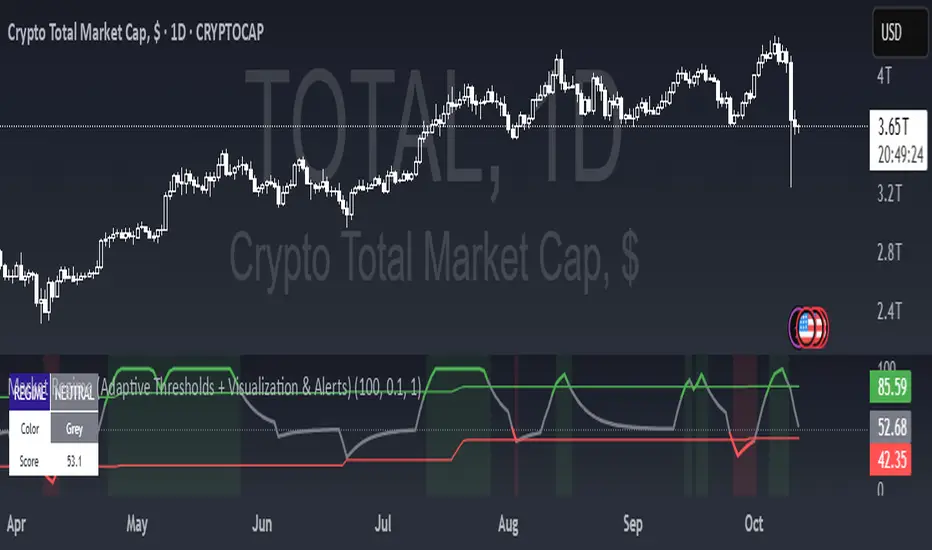
Visual Cues
- Green background = Strong trend (momentum strategies work)
- Red background = Strong mean reversion (contrarian strategies work)
- Table = Shows current regime, color, and score
- Alerts = Notifies when regime changes
開源腳本
秉持TradingView一貫精神,這個腳本的創作者將其設為開源,以便交易者檢視並驗證其功能。向作者致敬!您可以免費使用此腳本,但請注意,重新發佈代碼需遵守我們的社群規範。
免責聲明
這些資訊和出版物並非旨在提供,也不構成TradingView提供或認可的任何形式的財務、投資、交易或其他類型的建議或推薦。請閱讀使用條款以了解更多資訊。
免責聲明
這些資訊和出版物並非旨在提供,也不構成TradingView提供或認可的任何形式的財務、投資、交易或其他類型的建議或推薦。請閱讀使用條款以了解更多資訊。