OPEN-SOURCE SCRIPT
已更新 ACTION Locator v2.0

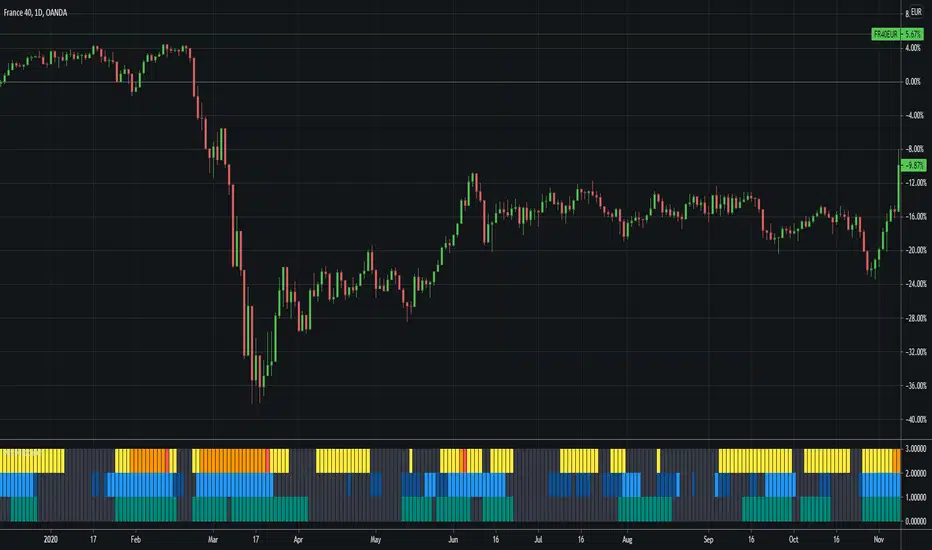
The indicator is based on making the standard deviation (where the mean is a moving average) a two-lines cross indicator, by applying an MA over it. When the standard deviation is above the MA, there is considered to be enough volatility in the market for trends to form.
Blue background = There is ACTION in the market -- signals it should be safe to trade
Gray background = No ACTION - DO NOT TRADE!
Blue background = There is ACTION in the market -- signals it should be safe to trade
Gray background = No ACTION - DO NOT TRADE!
發行說明
- Version 2.1 -- Added the Average Sigma Price Build-up signal to the indicator. This is usually quite a strong indication of possible ACTION in the market. Whenever this signals the background is less transparent, signaling a stronger volatility and a higher probability that the market will take ACTION.
- Corrected a bug in the LSMA calculation.
發行說明
- Version 2.2 -- Added checks against volatility indices in order to indicate whether or not there is
volatility in the market. You can choose between a volatility index for Forex (EVZ)
and two stock indices (VIX). The idea is that if there is volatility in the overall
market, there is a higher probability that the market will take ACTION.
Blue bars (above) = There is ACTION in the market -- signals it should be safe to trade
Gray bars (above) = No ACTION - DO NOT TRADE!
Teal bars (below) = There is force behind the ACTION!
Gray bars (below) = Less volatility in the market, be careful!
發行說明
- Version 2.3 -- Added a choppiness index filter as a third confirmation for volatility. This is the yellow row of bars. Yellow means there is no choppiness detected and should be safer to trade.
發行說明
- Version 2.4 -- Changed out the choppiness index for the BERLIN Range Index, as it is less laggy.
發行說明
- Version 2.5 -- Changed name to include the name of the algo this indicator is part of.
- Added licensing information in the comments.
- Added more information in the header comment to make the indicator easier to understand.
發行說明
- Version 2.6 -- Added option to alert for orange bars in the BERLIN Range Index (upper row).
發行說明
- Version 2.7 -- Made some options more clear and added dummy checkboxes to divide the settings into categories.
- Added more VIX tickers to the VIX ticker list to cover more markets.
- Added an option to adapt colors to bright mode (the TradingView color theme).
發行說明
- Version 2.8 -- Added a custom VIX that is calculated in a similar waythat the Bitcoin Historical Volatility Index (BVOL24H) is calculated, to make a kind of "adaptive" VIX that works on any market.
- Cleaned up a code a bit with line breaks.
發行說明
- Version 2.9 -- Updated the script to work with new updated pine script rules.
開源腳本
秉持TradingView一貫精神,這個腳本的創作者將其設為開源,以便交易者檢視並驗證其功能。向作者致敬!您可以免費使用此腳本,但請注意,重新發佈代碼需遵守我們的社群規範。
免責聲明
這些資訊和出版物並非旨在提供,也不構成TradingView提供或認可的任何形式的財務、投資、交易或其他類型的建議或推薦。請閱讀使用條款以了解更多資訊。
開源腳本
秉持TradingView一貫精神,這個腳本的創作者將其設為開源,以便交易者檢視並驗證其功能。向作者致敬!您可以免費使用此腳本,但請注意,重新發佈代碼需遵守我們的社群規範。
免責聲明
這些資訊和出版物並非旨在提供,也不構成TradingView提供或認可的任何形式的財務、投資、交易或其他類型的建議或推薦。請閱讀使用條款以了解更多資訊。