Katalyst's Opening Range BreakoutKatalyst's Opening Range Breakout + No Trade Zone
📜 Overview:
This indicator allows traders to visualize the high and low of the opening range for a user-selected timeframe (e.g., 30s, 1m, 5m, 15m). It features fully customizable lines, labels, and an optional **No Trade Zone** fill to help you identify breakout levels with ease.
---
🎯 Key Features:
1. **Customizable Opening Range**:
- Select your preferred opening range duration: **30 seconds, 1 minute, 2 minutes, 5 minutes, 10 minutes, or 15 minutes**.
- The indicator calculates and plots the **high** and **low** of the selected opening range.
2. **Dynamic Line Styling**:
- Choose the **line color**, **transparency**, and **style**: **Solid, Dashed, or Dotted**.
- Lines extend to the right of the chart for clarity.
3. **No Trade Zone** *(Optional / Disabled by default)*:
- When enabled, fills the area between the high and low lines with a customizable **color and transparency**.
- Helps visually identify consolidation areas where trading might be avoided.
4. **Labels for Precision**:
- Clearly displays the **Opening Range High** and **Low** values.
- Labels are color-coded and positioned dynamically for easy interpretation.
5. **Clean and Efficient Updates**:
- The indicator deletes old lines, labels, and fills before creating new ones, ensuring a clutter-free chart.
---
⚙️ How to Use:
1. **Select Your Timeframe**:
- From the settings, choose your desired opening range duration: 30s, 1m, 2m, 5m, 10m, or 15m.
2. **Customize the Visuals**:
- Adjust line color, style, and transparency.
- Enable the **No Trade Zone** for a transparent background fill between the high and low lines.
3. **Interpret the Breakout**:
- Watch for price movements above or below the **opening range** to identify potential breakout opportunities.
---
🛠 Settings:
Opening Range Duration: Select the timeframe for the opening range (30s, 1m, 2m, 5m, 10m, 15m).
Line Color: Set the color of the range lines.
Line Transparency: Adjust the transparency of the lines (0 = solid, 100 = invisible).
Line Style: Choose line style: Solid, Dashed, or Dotted.
Label Colors: Customize the label colors for the high and low values.
Enable No Trade Zone: Fill the area between high and low lines with a transparent color.
No Trade Zone Color: Set the fill color for the no trade zone.
No Trade Zone Transparency: Adjust the transparency of the no trade zone fill.
---
📈 Ideal For
Day traders and scalpers looking to trade **breakouts**.
Traders who want to identify areas of consolidation visually.
Anyone who relies on the **opening range** for their trading strategy.
---
🔍 Example Usage:
Set the opening range to **5 minutes** and enable the **No Trade Zone** with a light red fill.
Watch for price to break above or below the high/low lines to signal potential trade opportunities.
---
✨ Why Use This Indicator?
This script simplifies your breakout strategy by providing a clear, visually appealing representation of the opening range. The flexible customization options and the optional **No Trade Zone** make it a powerful tool for identifying high-probability trades.
---
Let me know if you need any additional tweaks or clarifications for this description. It's all set to help traders understand and use your powerful script! 🚀📈
CHOP

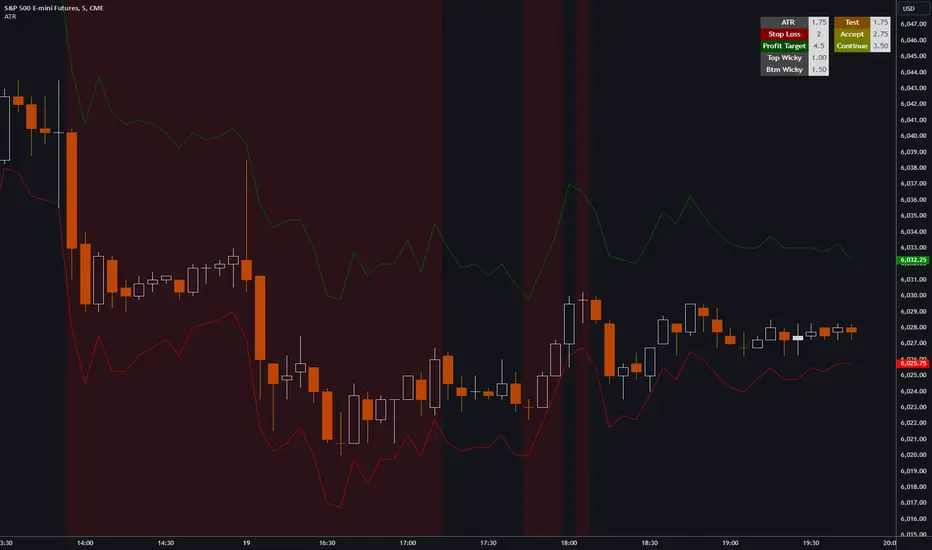
ATR, Chop, Profit Target and Stop Loss TableThe ATR Table indicator is a versatile tool that helps traders visually and quantitatively manage risk, identify market conditions, and set profit targets and stop-loss levels. It is designed to enhance decision-making by incorporating key volatility and chop (market consolidation) signals into a comprehensive table format.
Key Features:
Average True Range (ATR) Calculation : The indicator computes the ATR over a user-defined period (default 14). ATR helps to measure market volatility, providing insights into how much an asset's price typically moves within a given period.
Stop Loss and Profit Target Calculation : You can configure stop-loss and profit target levels using multipliers based on the ATR. This allows dynamic risk management that adjusts to market volatility:
Stop Loss : Defined as a multiple of the ATR to help control losses.
Profit Target : Also based on a multiple of the ATR to lock in gains. The user can specify whether they are trading long or short, and the indicator adjusts the levels accordingly.
Customizable Plot Lines : The indicator can display the Stop Loss and Profit Target levels directly on the chart. Users can toggle these lines on or off and customize their colors.
Chop Signa l: The indicator highlights potential consolidation periods (chop) using a wick-based analysis. It calculates the highest upper or lower wick values and compares them to the ATR to detect periods of indecision or consolidation.
Table Display : When these wick values exceed the ATR by a user-defined multiplier, the corresponding table rows are highlighted.
Background Alerts : Optionally, users can activate background color changes on the chart to visually alert them when chop conditions are detected.
Customizable Table Layout : A table displaying the key values (ATR, Stop Loss, Profit Target, Upper/Lower Wickiness) is placed on the chart. You can choose the table's position, adjust its color scheme, and decide which rows to display.
Chop Background Customization : For users who prefer more visual cues, the indicator allows you to enable or disable background shading when chop conditions are met. You can also choose the color of this background for better customization.
Session LiquidityDescribes if markets are liquid enough for institutions to manipulate. Its often difficult to determine if markets will trend or chop, but by looking at how much volume we have at the open, we can determine of the session will be choppy or trendy, and take trades based on that.
Settings predefined for 1m timeframe on SPY. May work with other tickers, but I have not tested it out yet.
Designed for stocks(as of now, may update later)

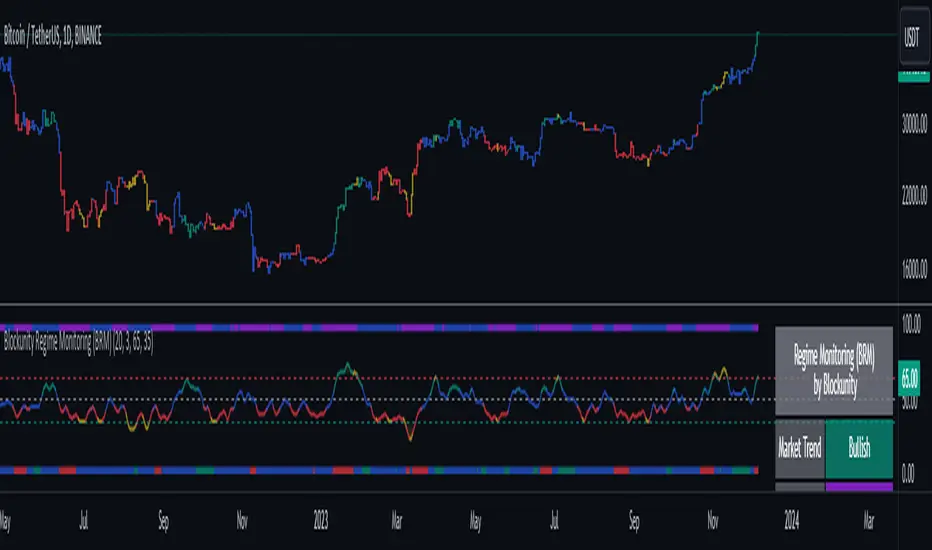
Blockunity Regime Monitoring (BRM)Efficiently analyze market conditions and detect overheating zones.
Regime Monitoring (BRM) is here to help you analyze the behavior of financial markets. The oscillator allows you to observe when an asset’s trend is likely to reverse. The trend is also given by the indicator, as is the phase the market is in (trending or congested). The BRM also provides the state of the Choppiness Index, indicating whether or not the asset is about to enter a more volatile phase.
The Idea
The goal is to provide the community with a comprehensive tool for tracking market conditions, with a visual approach to identifying overheating zones.
How to Use
This tool consists of 3 main components:
An oscillator, which we describe in detail below.
Bar color to transcribe oscillator information directly onto the graph. To activate Bar Color, make sure the first option is checked in the settings. You must also uncheck "Borders" and "Wick" in your Chart Settings.
A panel that summarizes the status of various indicator information.
Elements
The Regime Monitoring oscillator
The oscillator provides several information points. First, it gives the market trend of the asset:
Green: Bullish trend.
Red: Bearish trend.
Blue: Contested trend.
It then indicates areas of overheating, where it is considered statistically probable that we will see a change in trend dynamics. These moments are shown in yellow.
This market trend is also indicated in the table.
If you see that the oscillator is above or below these limits, but not yellow, this is because we use a Choppiness Index to filter this information.
The "Enable Choppiness Index Filter" is enabled by default in the settings. So, if the Chop is discharged (under 38.2), then the oscillator's overheating state is ignored.
You can see the difference in the images below, the first with the filter and the other without:
Market Phase
We use a Vertical Horizontal Filter (VHF) to define the market phase the asset is in. This phase can have two values:
Trending: Assets evolve within a trend.
Congestion: The asset is in a moment of congestion.
Chop State
Visualize the Choppiness Index, indicating whether an asset is gearing up to enter a phase of increased volatility. It can be:
Charged: Chop is considered to indicate to be entering a stable phase.
Neutral: Chop is neutral and does not provide any specific information.
Discharged: Chop is considered to indicate a continuation of the trend.
In addition, with the "Show Choppiness Index" option, you can plot the Chop on the oscillator:
Other Settings
You can also modify the standard Regime Monitoring parameters (Lookback, Smoothing, Limits), display or hide certain components, and change all the colors.
How it Works
Regime Monitoring's main oscillator is established as follows:
We calculate the percentage of times the closing price was higher than the opening price. This is then divided by a lookback period, which in this case defaults to 20. This calculation gives a probability of the current regime.
Simple Chop ZoneThe original Chop Zone indicator by Trading View is good, but has a few limitations which I've addressed in this one
Too many colors which confuse and/or overwhelm users like me
Inability to change the EMA period
This one has just 3 customizable colors for
Uptrend - default = Turquoise
Downtrend - default = red
Everything else - default = lime
And you can set your own EMA length. The default is 34 as per the original Chop Zone indicator

Local Model Kalman Market ModeIntroduction
Heyo guys, I made a new (repainting) indicator called Local Model Kalman Market Mode.
I created it, because I wanted a reliable market mode filter for a potential mean-reversion strategy (e. g. BB Scalping).
On the screenshot you can see an example of how to use it in a BB strategy.
E.g. you would enter long when you have bullish divergence, price is under lower BB, price is under PoC and this indicator here shows range-bound market phase.
You would exit long on cross of the middle band.
Description
The indicator attempts to model the underlying market using different local models (i.e., trending, range-bound, and choppy) and combines them using the T3 Six Pole Kalman Filter to generate an overall estimate of the market.
The Fisher Transform is applied on the price to reach a Gaussian distribution, which increases the accuracy of the indicator itself.
The script first defines state variables for each local model, which include trend direction, trend strength, upper and lower bounds of the range, volatility of the range, level of choppiness, and strength of noise.
Then, likelihood functions are defined for each local model based on the state variables.
Next, the script calculates weights for each local model based on their likelihoods and uses them to calculate state variables for the overall estimate.
Finally, the script combines the state variables using the T3 Six Pole Kalman Filter to generate the overall estimate of the market, which is plotted in blue.
Fundamental Knowledge
To understand the explanation of the indicator and the script, there are a few fundamental concepts that you need to know:
Market: A market is a place where buyers and sellers come together to exchange goods or services.
In the context of trading, the market refers to the exchange where financial instruments such as stocks, currencies, and commodities are bought and sold.
Local models: Local models are statistical models that attempt to capture the characteristics of a particular market regime.
For example, a trending market may have different characteristics than a range-bound market or a choppy market.
The indicator uses different local models to capture the different market regimes.
Trend direction and strength: The trend direction refers to the direction in which the market is moving, either up or down.
The trend strength refers to the magnitude of the trend and how likely it is to continue.
Range-bound market: A range-bound market is a market where prices are trading within a specific range, with a clear upper and lower bound.
Choppiness: Choppiness refers to the degree of irregularity in price movements, often seen in sideways or range-bound markets.
Volatility: Volatility refers to the degree of variation in the price of an asset over time. High volatility implies larger price swings, while low volatility implies smaller price swings.
Kalman filter: A Kalman filter is a mathematical algorithm used to estimate an unknown variable from a series of noisy measurements.
In the context of the indicator, the Kalman filter is used to generate an overall estimate of the market by combining the local models.
T3 Six Pole Kalman Filter: The T3 Six Pole Kalman Filter is a specific type of Kalman filter that is used to smooth and filter time-series data, such as the price data of a financial instrument.
Fisher Transform: The Fisher Transform is a mathematical formula used to transform any probability distribution into a Gaussian normal distribution. It is commonly used in technical analysis to transform non-Gaussian indicators into ones that are more suitable for statistical analysis.
By understanding these fundamental concepts, you should have a basic understanding of how the indicator works and how it generates an overall estimate of the market.
Usage
You can use this indicator on every timeframe.
Users can customize the parameters of the T3 Six Pole Kalman Filter (T3 length, alpha, beta, gamma, and delta) using input functions.
Try out different parameter combinations and use the one you like most.
Thank you for checking this out. Leave me a comment or boost the script, when you wanna support me! 👌
--
Credits to:
▪@HPotter - Fisher Transform
▪@loxx - T3
▪ChatGPT - Helped me to make the research for this indicator and helped to build the core algorithm.

RedK Chop & Breakout Scout (C&B_Scout)The RedK Chop & Breakout Scout (C&BS or just CBS) is a centered oscillator that helps traders identify when the price is in a chop zone, where it's recommended to avoid trading or exit existing trades - and helps identify (good & tradeable) price breakouts.
i receive many questions asking for simple ways to identify chops .. Here's one way we can do that.
(This is work in progress - i was exploring with the idea, and wasn't sure how interesting other may find it. )
Quick Intro:
==================
Quick techno piece: This concept is similar to a Stochastic Oscillator - with the main difference being that we're utilizing units of ATR (instead of a channel width) to calculate the main indicator line - which will then lead to a non-restricted oscillator (rather than a +/- 100%) - given that ATR changes with the underlying and the timeframe, among other variables.
to make this easy, and avoid a lot of technical speak in the next part, :) i created (on the top price panel) the same setup that the C&B Scout represents as a lower-panel indicator.
So as you read below, please look back and compare what C&BS is doing in its lower panel, with how the price is behaving on the price chart.
how this works
========================
- To identify chops and breakouts, we need to first agree on a definition that we will use for these terms.
- for the sake of this exercise, let's agree that the price is in a chop zone, as long as the price is moving within a certain distance from a "price baseline" of choice ( which we can adjust based on the underlying, the volatility, the timeframe, the trading style..etc)
- when the price moves out of that chop zone, we consider this a breakout
- Now not all breakouts are "good" = they need to at least happen in the direction of the longer term trend. In this case, we can apply a long Moving Average to act as a filter - and consider breakouts to be "good" if they are in the same direction as the filter line
- With the above background in mind, we establish a price baseline (as you see on the top panel, this is based on the midline of a Donchian Channel - but we can use other slow moving averages in future versions)
- we will decide how far above/below that baseline is considered to be "chop zone" - we do this in terms of units of Average True Range (ATR) - using ATR here is valuable for so many reasons, most of all, how it adjusts to timeframe and volatility of underlying.
- The C&B Scout line simply calculates how far the price is above/below the baseline in terms of "ATR units". and shows how that value compares to our own definition of a "chop zone"
- so as long as the price is within the chop zone, the CBS line will be inside the shaded area - and when the price "breaks out" of the chop zone, the CBS line will also breakout (or down) from the chop zone.
- C&B Scout will give a visual clue to help take trades in the direction of the prevailing trend - the chop zone is green when the price is in "long mode", as in, the price is above the filter line - and will be red when we are in "short mode" - so the price is below the filter line. in green mode, we should only consider breakouts to the upside, and ignore breakouts to the downside (or breakdowns) - in red mode, we should only consider breakouts to the downside., and ignore the ones to the upside.
- i added some examples of "key actions" on the chart to help explain the approach here further.
Usage & settings Notes:
========================
- even though for many traders this will be a basic concept/setup, i still highly suggest you spend time getting used to how it works/reacts and adjusting the settings to suit your own trading style, timeframe, tolerance, what you trade....etc
- for example, if i am a conservative trader, i may consider any price movement within 1 x ATR above and below the baseline to be in "chop" (ATR Channel width = 2 x ATR) - and i want to only take trades when the price moves outside of that range *and* in the direction of the prevailing trend
- An aggressive trader may use a smaller ATR-based value, say 0.5 x ATR above/below the baseline, as their chop zone.
- A swing trader may use a shorter filter line and focus on the CBS line crossing the 0 line.
- .... and so on.
- Also note that the "tradeable" signal is when the CBS line "exits" the chop zone (upward on green background, or downward on red background) - however, an aggressive trader may take the crossing of the CBS line with the 0 line as the signal to open a trade.
- As usual please do not use this indicator "in isolation" and ensure you have other confirming signals from your setups before trading.
conclusion
===========
As i mentioned, this is really a simple concept - and i'm a big fan of those :) -- and there's so much that could be done to expand around it (add more visuals/colors, add alerts, add options for ATR calculation, Filter line calculations, baseline..etc) - but with this v1.0, i wanted to share this initially and see how much interest and how valuable fellow traders find it, before playing any further with it. so please be generous with your comments.

Binance CHOP Dashboard by KziHere is a Dashboard to find the opportunuty of bigs moves with 20 pairs.
The Dashboard is too big for the phone view. I thinks we can use it only on computer view.
How it's work ?
I look for the CHOP on Weekly and Daily time frame
The CHOP give the "tension" of the pair.
So i look for the biggest "tension" to take the "big mooves"
I look for the align tension between weekly and daily
The CHOP can be 0 to 100 , the result is:
(Weeky CHOP x Daily CHOP) = 0 to 10 000
To make the result easy to read, i divide so that the "note" is between 0 and 10.
If you have more than 3 /10 = RED => HOT Opporunity for big mooves
If you have less than 1/10 = BLUE => COLD opporunity
Thanks for your comment,
Kzi
The code is well.
But i think there is an opportunity to do it better with some for loop.
Is some of you do it, please let's me know.

Oster Double ChopThis indicator is based on the Chopiness Index. If you're used to trade with the Chop, you may check several timeframes to enter a position. It starts getting annoying to check 2 timeframes for every single position you want to enter in, thanks to this indicator, you'll be able to monitor it in a single indicator.
2 parameters will have to be set up:
Fixed timeframe
Session timeframe
The fixed timeframe is a timeframe that will be locked, and displayed no matter your session timeframe. You can change it in the parameters.
The session timeframe will depend on the timeframe selected on your chart.
By this way you can monitor 1 timeframe for any chart, and the other chop is flexible depending on what timeframe you're monitoring.
NOTE: if your session timeframe is the same as the fixed timeframe, you will see only one chop line because they overlay.
Have a nice trading!

CHOPORSI
CHOPORSI is a multiindicator.
This indicator help You to recognize potential in or out singal.
Base singals are from Choppines, RSI, AND DMI indicators.
It is a combination of 3 separate indicators like choppines RSI and DMI.
Then our new indicator see like bellow on next image.
Yellow line is sum of CHOP index and RSI , in this case we can say its a CHOPORSI Index.
Green line is DMI- line , this show us strength of sell position on the market.
We schould use other signals, like LSMA 50/100 to improve trend changing. Like on next picture.
Now how this indicator works?
Yellow line is the sum oF Chop and RSI value - 50.
Max and minimum value of CHOP and RSI are the same from 0 to 100.
We have sum of them.
Our minimum signal is 0+0-50=-50
maximum signal is 100+100-50= 150
Most times if both of tem are on top level ( then we have 150) the trend is chanhing from bullish to bearish.
The same way if the RSI ist on 0 and chop is over 50 ( then we have index 0 ) wee changing the tren from bearish to bullish.
Off course it not every time. We see other signals, to take our risk self not sugested by some art of indicators.
But if we are abowe topline, witch is set to 85 we can sey, we have have oversold signal.
Underline 30 isour potentialy buy signal.
Midrange 50 is mostly trand changin line.
This valu of top, mid bottom line you can change on the setting.
Every Coin have another level of this lines, and need to be checked individual to the coin.
Standard, settings are set fo timeframe : 12 min. 24 min, 1H and 4 H >
Blue crosses signalize possibilities trend changing.
This picture shou us how this indicator works.
Buy long signal : If yellow line is mostly at the bottom and green mostly on the top.
Sell long signal l. Yellow -top , green -bottom.
The Green line is from Directional Movement Index and is - DI line. Its show us selling trend. even higher position then mor sell of .
Standard value of CHOPPINES is 14 , works fin on 1H and abowe also wit the value of 28
Standard value for RSI AND -DI unchanging 14.
I tjink this is a simplu helpfull indycator.
WARNING!!! IF YOU AT THIS POINT CANT UNDERSUD THIS INDICATOR, PLEASE DONT USE THEM .
Signal, schould be confirmed with other indicators like MA, EMA even better with LSMA .
Please try it an make only paper trading, to undertand how its realy works.
Thank You!

CHOPperIt is based on the Choppiness Index indicator. It can show you when the market is in range. If the lines are below the lower band, it can be a strong trend, if it is inside the 2 bands, it is considered to be a choppy market, and if it is crossed down the upper band, it can be a developing trend.
This indicator does not show you the trend direction! This may be used as a confirmation indicator.
The improvements this indicator provides over the original:
It uses ATR instead of just TR (if ATR length is 1, it is the original TR)
It uses my ATRWO (ATR Without Outliers) indicator inside, which can remove extreme highs and lows from calculation. You can tune this by the "ATRWO STDev Mult" parameter. Higher value means more outliers are allowed.
It has 2 lines, one uses ATR(WO) (the blue one), which can be similar to the original Choppiness Index, the other uses standard deviation (the teal one).
The 2 lines can be used together, or you can hide one of them.

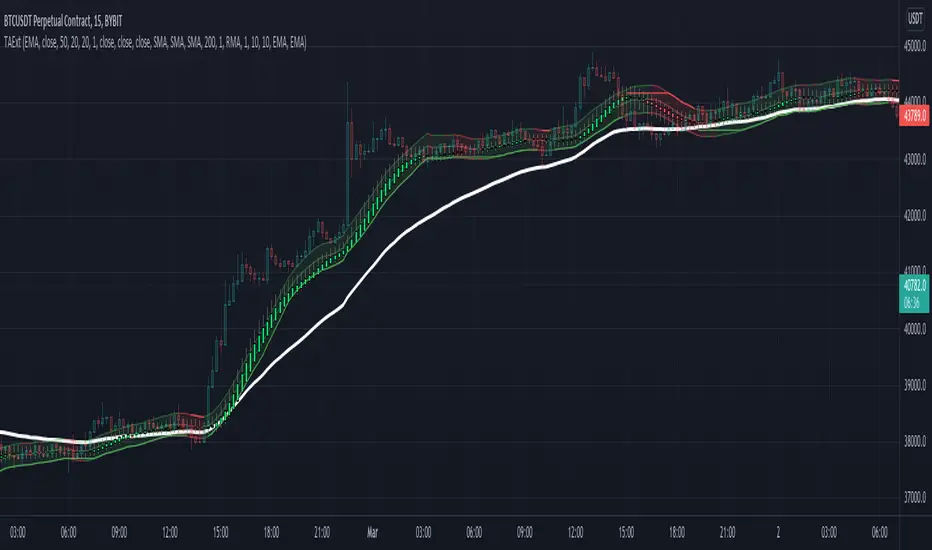
TAExtLibrary "TAExt"
Indicator functions can be used in other indicators and strategies. This will be extended by time with indicators I use in my strategies and studies.
atrwo(length, stdev_length, stdev_mult) ATR without outliers
Parameters:
length : The length of the ATR
stdev_length : The length of the standard deviation, used for detecting outliers
stdev_mult : The multiplier of the standard deviation, used for detecting outliers
Returns: The ATR value
atrwma(src, period, type, atr_length, stdev_length, stdev_mult) ATR without outlier weighted moving average
Parameters:
src : The source of the moving average
period : The period of the moving average
type : The type of the moving average, possible values: SMA, EMA, RMA
atr_length : The length of the ATR
stdev_length : The length of the standard deviation, used for detecting outliers
stdev_mult : The multiplier of the standard deviation, used for detecting outliers
Returns: The moving average value
jma(src, period, phase, power) Jurik Moving Average
Parameters:
src : The source of the moving average
period : The period of the moving average calculation
phase : The phase of jurik MA calculation (-100..100)
power : The power of jurik MA calculation
Returns: The Jurik MA series
anyma(src, period, type, offset, sigma, phase, power) Moving Average by type
Parameters:
src : The source of the moving average
period : The period of the moving average calculation
type : The type of the moving average
offset : Used only by ALMA, it is the ALMA offset
sigma : Used only by ALMA, it is the ALMA sigma
phase : The phase of jurik MA calculation (-100..100)
power : The power of jurik MA calculation
Returns: The moving average series
wae(macd_src, macd_fast_length, macd_slow_length, macd_sensitivity, bb_base_src, bb_upper_src, bb_lower_src, bb_length, bb_mult, dead_zone_length, dead_zone_mult) Waddah Attar Explosion (WAE)
Parameters:
macd_src : The source series used by MACD
macd_fast_length : The fast MA length of the MACD
macd_slow_length : The slow MA length of the MACD
macd_sensitivity : The MACD diff multiplier
bb_base_src : The source used by stdev
bb_upper_src : The source used by the upper Bollinger Band
bb_lower_src : The source used by the lower Bollinger Band
bb_length : The lenth for Bollinger Bands
bb_mult : The multiplier for Bollinger Bands
dead_zone_length : The ATR length for dead zone calculation
dead_zone_mult : The ATR multiplier for dead zone
Returns:
ssl(length, high_src, low_src) Semaphore Signal Level channel (SSL)
Parameters:
length : The length of the moving average
high_src : Source of the high moving average
low_src : Source of the low moving average
Returns:
adx(atr_length, di_length, adx_length, high_src, low_src, atr_ma_type, di_ma_type, adx_ma_type) Average Directional Index + Direction Movement Index (ADX + DMI)
Parameters:
atr_length : The length of ATR
di_length : DI plus and minus smoothing length
adx_length : ADX smoothing length
high_src : Source of the high moving average
low_src : Source of the low moving average
atr_ma_type : MA type of the ATR calculation
di_ma_type : MA type of the DI calculation
adx_ma_type : MA type of the ADX calculation
Returns:
Chop Zone - SamXThis is my spin on the Chop Zone indicator. It was forked from the built-in TradingView Chop Zone indicator. There were several reasons for this effort...
The built-in indicator version had no real configuration options
It was hard-coded to use the 34-period EMA with fixed span sizes for identifying price range
There was no real context to the meaning of default color scheme
The separation points of the chop zone bars was at a fixed 1.43-degree scale
Note: If left at default settings, this indicator will exactly match the built-in Chop Zone indicator.
WARNING : Please be sure you understand the potential impact and implications before adjusting any of the settings in the "Advanced Configuration" section!!!
Chop Zone with discrete/standard coloring:
Chop Zone with gradient fill:
Moving Average angle plot with gradient fill:

Choppiness Index TileA simple tile on the chart that indicates the choppiness index on the chart for the chart's timeframe. The index tile will show 3 different colors based on the value of the choppiness index. 61.8 for the high threshold and 38.2 for the lower threshold.

CHOP Zone Entry Strategy + DMI/PSAR ExitThis is a Strategy with associated visual indicators and Long/Short and Reverse/Close Position Alerts for the Choppiness Index (CHOP) . It is used to determine if the market is choppy (trading sideways) or not choppy (trading within a trend in either direction). CHOP is not directional, so a DMI script was ported into this strategy to allow for trend confirmation and direction determination; it consists of an Average Directional Index (ADX) , Plus Directional Indicator (+DI) and Minus Directional Indicator (-DI) . In addition, a Parabolic SAR is also included to act as a trailing stop during any strong trends.
Development Notes
---------------------------
This indicator, and most of the descriptions below, were derived largely from the TradingView reference manual. Feedback and suggestions for improvement are more than welcome, as well are recommended Input settings and best practices for use.
www.tradingview.com
www.tradingview.com
www.tradingview.com
Recommend using the below DMI and PSAR indicators in conjunction with this script to fully visualize and understand how entry and exit conditions are chosen. Variable inputs should correlate between the scripts for uniformity and visual compatibility.
THANKS to LazyBear and his Momentum Squeeze script for helping me quickly develop a momentum state model for coloring the Chop line by trend.
Strategy Description
---------------------------
CHOP produces values that determine whether the market is choppy or trending . The closer the value is to 100 , the higher the choppiness levels , while the closer it is to 0 , the stronger the market is trending . Territories for both levels, and their associated upper and lower thresholds, are popularly defined using the Fibonacci Retracements, 61.8 and 38.2.
Basic Use
---------------------------
CHOP is often used to confirm the market condition to help you stay out of sideways markets and only enter when there is movement or imminent explosions. When readings are above the upper threshold, continued sideways movement may be expected, while readings below the lower threshold are typically indicative of a continuing trend. It is also used to anticipate upcoming trendiness changes, with the general belief that extended periods of consolidation (sideways movement) are followed by extended periods of strong, trending, directional movement, and vice versa.
One limitation in this index is that you must be cautious in deciding whether the range or trend will likely continue, or if it will reverse.
Confidence in price action and trend is higher when two or more indicators are in agreement -- while this strategy combines CHOP with both DMI and PSAR, we would still recommend pairing with other indicators to determine entry or exit trade opportunities.
Recommend also choosing 'Once Per Bar Close' when creating alerts.
Inputs
---------------------------
Strategy Direction - an option to only trade Short, Long, Both, or only in the direction of the Trend (Follow Trend is the Default).
Sensitivity - an incremental variable to test whether the past n candles are in the same trend state before triggering a delayed long or short alert (1 is the Default). Can help filter out noise and reduces active alerts.
Show Chop Index - two visual styles are provided for user preference, a visible Chop line with a background overlay, or a compact column and label only view.
Chop Lookback Period - the time period to be used in calculating CHOP (14 is the Default).
Chop Offset - changing this number will move the CHOP either forwards or backwards relative to the current market (0 is the Default).
Smooth Chop Line and Length - if enabled, the entered time period will be used in calculating a smooth average of the index (Enabled and 4 are the Defaults).
Color Line to Trend Direction - toggles whether the index line is colored to visually depict the current trend direction (Enabled is the Default).
Color Background - toggles the visibility of a background color based on the index state (Enabled is the Default).
Enable DMI Option - if enabled, then entry will be confirmed by and dependent on the ADX Key Level, with any close or reversal confirmed by both ADX and +/-DI to determine whether there is a strong trend present or not (Enabled is the Default).
ADX Smoothing - the time period to be used in calculating the ADX which has a smoothing component (14 is the Default).
DI Length - the time period to be used in calculating the DI (14 is the Default).
ADX Key Level - any trade with the ADX above the key level is a strong indicator that it is trending (23 to 25 is the suggested setting).
Enable PSAR Option - enables trailing stop loss orders (Enabled is the Default).
PSAR Start - the starting value for the Acceleration Force (0.015 is our chosen Default, 0.02 is more common).
PSAR Increment - the increment in which the Acceleration Force will move (0.001 is our chosen Default, 0.02 is more common).
PSAR Max Value - the maximum value of the Acceleration Factor (0.2 is the Default).
Color Candles Option - an option to transpose the CHOP condition levels to the main candle bars. Note that the outer red and green border will still be distinguished by whether each individual candle is bearish or bullish during the specified timeframe.
Note too that if both DMI and PSAR are deselected, then close determinations will default to a CHOP reversal strategy (e.g., close long when below 38.2 and close short when above 61.8). Though if either DMI or PSAR are enabled, then the CHOP reversal for close determination will automatically be disabled.
Indicator Visuals
---------------------------
For the candle colors, black indicates tight chop (45 to 55), yellow is loose chop (38.2 to 45 and 55 to 61.8), dark purple is trending down (< 38.2), and dark blue is trending up (> 61.8).
The background color has additional shades to differentiate a wider range of more levels…
• < 30 is dark purple
• 30 to 38.2 is purple
• 38.2 to 45 is light purple
• 45 to 55 is black
• 55 to 61.8 is light blue
• 61.8 to 70 is blue
• > 70 is dark blue
Long, Short, Close, and Reverse labels are plotted on the Chop line, which itself can be colored based on the trend. The chop line can also be hidden for a clean and compact, columnar view, which is my preferred option (see example image below).
Visual cues are intended to improve analysis and decrease interpretation time during trading, as well as to aid in understanding the purpose of this strategy and how its inclusion can benefit a comprehensive trading plan.
DMI and Trend Strength
---------------------------
To analyze trend strength, the focus should be on the ADX line and not the +DI or -DI lines. An ADX reading above 25 indicates a strong trend , while a reading below 20 indicates a weak or non-existent trend . A reading between those two values would be considered indeterminable. Though what is truly a strong trend or a weak trend depends on the financial instrument being examined; historical analysis can assist in determining appropriate values.
DMI exits trade when ADX is below the user selected key level (e.g., default is 25) and when the +/- DI lines cross (e.g., -DI > +DI exits long position and +DI > -DI exits short position).
PSAR and Trailing Stop
---------------------------
PSAR is a time and price based indicator that excels at measuring direction and duration, though not the actual strength of a trend, which is why we use this in conjunction with DMI. It is also included in this script as a trailing stop option to maximize gains during strong trends and to mitigate any false ADX strengthening signals.
This creates a parabola that is located below the candle during a Bullish trend and above during a Bearish trend. A buy or reversal is signaled when the price crosses above or below the Parabolic SAR.
Long/Short Entry
---------------------------
1. CHOP must be over 61.8 (long) or under 38.2 (short).
2. If DMI is enabled, then the ADX signal line must be above the user selected Key Level (default is 25).
3. If Sensitivity is selected, then that past candle must meet the criteria in step 1, as well as all the intermediate candles in between.
4. If "Follow Trend" is selected and PSAR is enabled, then a long position can only open when the momentum and PSAR are in an uptrend, or short when both are in a downtrend, to include all intermediate candles if the Sensitivity option is set on a past candle.
Close/Reverse
---------------------------
1. If DMI is enabled, then a close flag will be raised when the ADX signal drops below the Key Level (of 25), and -DI crosses over +DI (if long), or +DI crosses over -DI (if short).
2. If PSAR is enabled, then a close flag will be raised when the current trend state is opposite the last state.
3. If both DMI and PSAR are disabled, then a close flag will be raised if the Chop line drops under 38.2 (if long) or goes over 61.8 (if short).
4. If a Long or Short Entry is triggered on the same candle as any of the above close flags, then the position will be reversed, else the position will be closed.
Strategy Alerts
---------------------------
1. Long Entry
2. Short Entry
3. Reverse
4. Close
The provided backtest result is based on a position sizing of 10% equity with 100k initial capital. When testing SPX, disabling the DMI performed the best, but EURUSD performed poorly without it enabled, and TSLA had a small reduction in net profit. Timeframe likewise differed between commodities with TSLA performing best at 30M, SPX at 15M, and EURUSD at 4H. I do not plan on using this as a standalone strategy, but I also was expecting better results with the inclusion of EMI and PSAR to compliment the CHOP. Key elements of this script will likely be included in future, more holistic strategies.
Disclaimer
---------------------------
Past performance may not be indicative of future results. Due to various factors, including changing market conditions, the strategy may no longer perform as well as in historical backtesting. This post and the script are not intended to provide any financial advice. Trade at your own risk.
No known repainting, though there may be if an offset is introduced in the Inputs. I did my best not to code any other variables that repaint, but cannot fully attest to this fact.

Choppiness Index and RSI by ceyhun
Choppiness Index and RSI by ceyhun
This indicator is based on the inverse relationship between CHOP and RSI.
Bar color
If the RSI is greater than CHOP, the Bar color will be blue.
If CHOP is greater than RSI, the bar color will be red.
CHOP
If CHOP is less than 38.2, the color will turn blue. positive
If the CHOP is between 38.2 and 61.8, the color will be yellow and neutral.
If CHOP is greater than 61.8, the color will turn red. negative
Rsi
If Rsi is greater than 61.8, the color will turn blue, positive
If Rsi is between 38.2 and 61.8, the color will be hexagonal and neutral
If Rsi is less than 38.2 the color will be red, negative
The Choppiness Index (CHOP) is an indicator designed to determine if the market is choppy (trading sideways) or not choppy (trading within a trend in either direction). The Choppiness Index is an example of an indicator that is not directional at all. CHOP is not meant to predict future market direction, it is a metric to be used to for defining the market's trendiness only. A basic understanding of the indicator would be; higher values equal more choppiness, while lower values indicate directional trending.
Relative Strength Index (RSI)
The Relative Strength Index (RSI) is a well versed momentum based oscillator which is used to measure the speed (velocity) as well as the change (magnitude) of directional price movements. Essentially the RSI, when graphed, provides a visual mean to monitor both the current, as well as historical, strength and weakness of a particular market. The strength or weakness is based on closing prices over the duration of a specified trading period creating a reliable metric of price and momentum changes. Given the popularity of cash settled instruments (stock indexes) and leveraged financial products (the entire field of derivatives); RSI has proven to be a viable indicator of price movements.

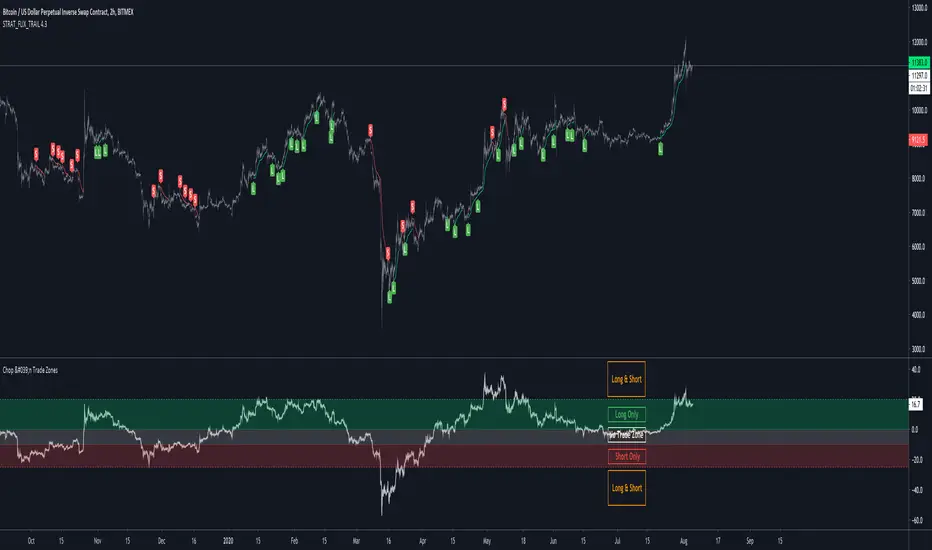
Tool: Chop & Trade ZonesA simple yet powerful way to filter out choppy ranges or sideways moves without missing out on good trades
It calculates the %-distance of the price to a moving average so you can ignore buy/sell signals around the center line.
The upper and lower line are thresholds to catch reversals of the trend when the distance to moving average is increasing.
Thanks @dgtrd and @imzeeshan for the inspiration 🙏
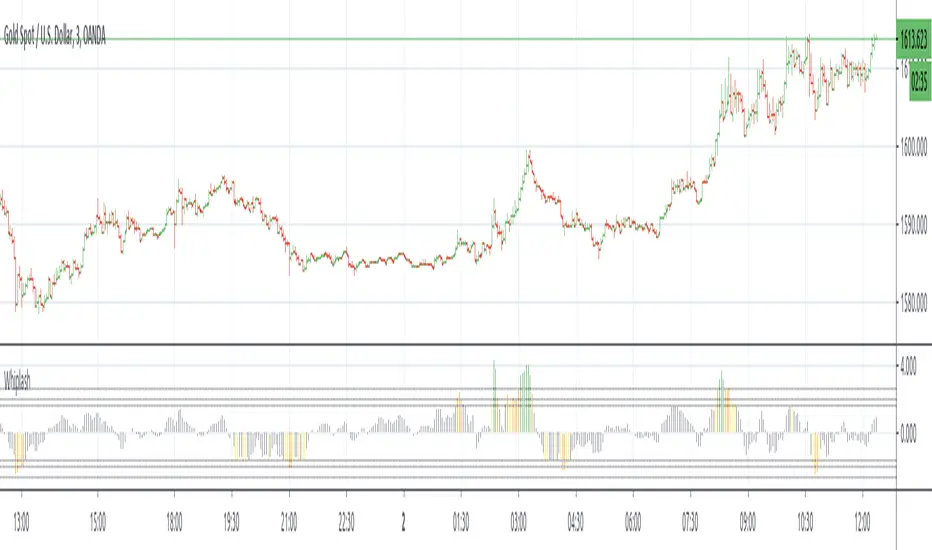
WhipLashThis is a study to determine if small candle bodies (little difference between open and close), regardless of overall candle length (high/low), can be used to filter choppy markets.
The indicator will calculate the selected average "MA Mode" of (close-open). To standardize this result and ensure any filters/thresholds do not need to be recalculated for each instrument the result will be used to calculate the Z Score.
The idea is that when candle bodies are small there is very little actual price movement, and therefore price is choppy. When considering the Z Score of that result, any outliers ie larger candle bodies, could show a potential trend forming. This indicator is similar to QStick but allows more customization by the user.
MA Mode determines which MA is used to smooth the results of (close-open)
Price Smoothing is the number of running periods the MA Mode is calculated for.
The three Thresholds are preset to the 90%, 95%, and 99% levels for Z Score. If these thresholds are altered you may wish to also alter the horizontal lines programmed for each level on the positive and negative sides.
The Z Length is the period for which the Z Score is calculated
Multiple MA Options Credits to @Fractured
Bits and Pieces from @AlexGrover, @Montyjus, and @Jiehonglim
As always, trade at your own risk.
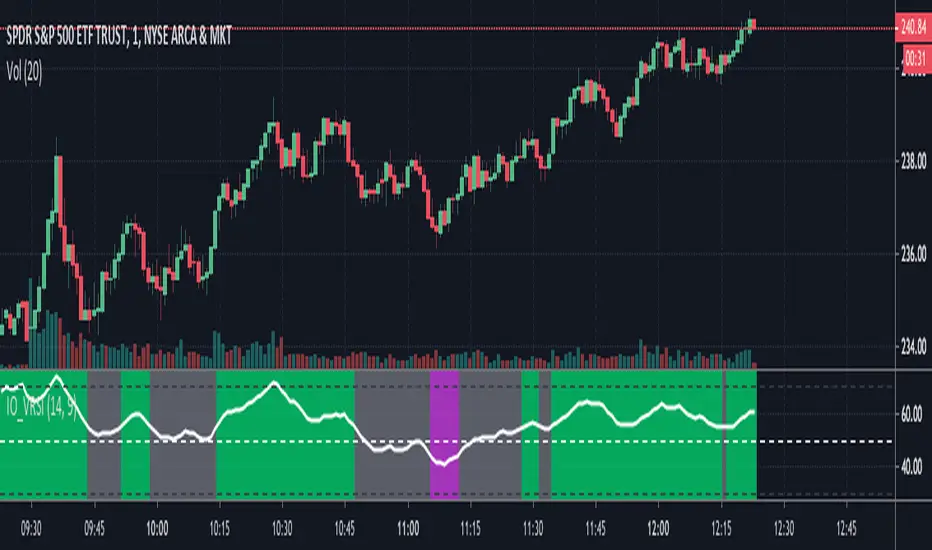
IO_VRSIOriginal Idea by Invsto
In this indicator, I explore the core concepts of RSI and extend it with smoothening to determine volatility.
Usage:
LIME/GREEN : High Volatility and BULLISH trend
RED/FUCHSIA : High Volatility and BEARISH trend
GRAY: Low volatility/Potential Chop Zone
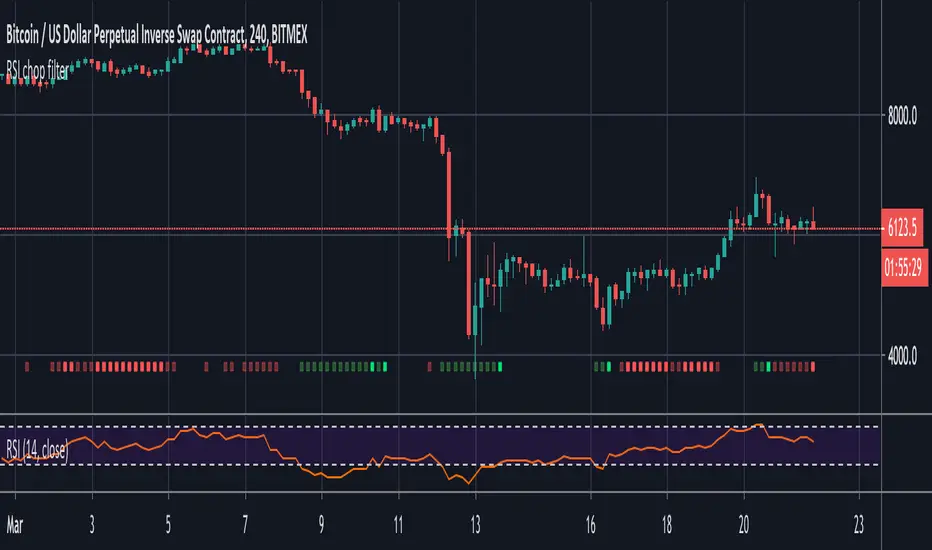
RSI chop filterThis demonstrates how you might filter your signals using RSI, but the same technique could be applied to Stochastic RSI and any other oscillator that has overbought and oversold conditions.
Use it as a visual indicator to determine when to enter a trade:
Red = Chop zone (no trade)
Bright red = Tight chop (dear god stay away)
Green = Overbought or oversold (signals permitted)
Bright green = Crossing up/down (take the trade)
To apply the filter, simply add 'and not chop' after your conditions as seen in the commented out example.
VQZL Z-ScoreVolatility Qaulity Zero Line attempts to keep a trader out of ranging markets, but the original calculation on TradingView had to be adjusted for each instrument. To avoid this issue, I have applied a z-score calculation to the VQZL so the result is standardized for all instruments. A Z-Score is simply a value's relationship to the mean (average) of a group of values, measured in terms of standard deviations from the mean.
This calculation allows us to compare current volatility to the mean (moving average) of the population (Z-Length). The closer the VQZL Z-Score is to the mean, the closer it will be to the Zero Line and therefore price is likely consolidating and choppy. The farther VQZL Z-Score is from the mean, the more likely price is trending.
The MA Mode determines the Moving Average used to calculate VQZL itself. The Z-Score is ALWAYS calculated with a simple moving average (as that is the standard calculation for Z-Score).
The Threshold Levels are the levels at which VQZL Z-Score will change from gray to yellow, orange, green (bullish), or red (bearish). These levels can be adjusted but you should adjust the Threshold Lines as well (in the style section), so they line up with your adjusted values.
Statistically speaking, confidence levels in relation to Z-Score are noted below. The built in Threshold Levels are the positive and negative values for 90%, 95%, and 99%. This would indicate when volatility is greater than these values they are out of the ordinary from the standard range. You may wish to adjust these levels for VQZL Z-Score to be more responsive to your trading need
80% :: 1.28
85% :: 1.44
90% :: 1.64
95% :: 1.96
99% :: 2.58
As always, trade at your own risk.
VQZL Created by Investo And Adapted From @sarangab
Multiple MA Options Credits to @Fractured
Bits and Pieces from @AlexGrover and @Montyjus

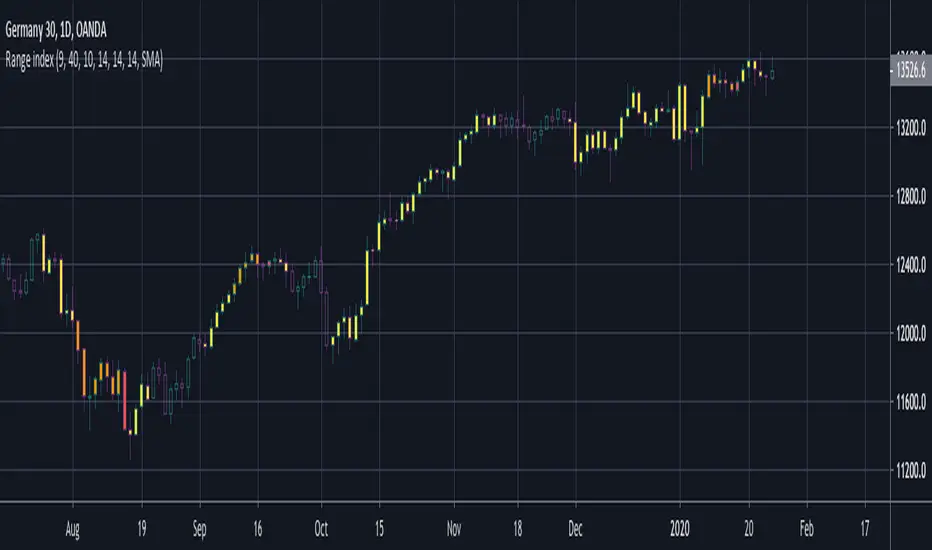
BERLIN Range Index | Panel versionThe original problem: The choppiness index is great at finding ranging markets, but it is sometimes very slow, which means most of the time it only catches the end of a trend.
This indicator tries to solve this. It uses the choppiness index and filters it using a factor that is based on the standard deviation of the ATR.
The ATR based filter is calculated by first calculating the running standard deviation of the ATR, and then looking at that in relation to its recent low to find a filtering factor to use on the choppiness index. This makes the choppiness index more reactive to trends, but also slightly more likely to missidentify ranges.
This is the panel version of the indicator. It plots the index and min/max values, as well as background colors to tell you when it thinks the market is ranging or trending.
Yellow = Trending
Transparent gray = Ranging

BERLIN Range Index | Bar color versionThe original problem: The choppiness index is great at finding ranging markets, but it is sometimes very slow, which means most of the time it only catches the end of a trend.
This indicator tries to solve this. It uses the choppiness index and filters it using a factor that is based on the standard deviation of the ATR.
The ATR based filter is calculated by first calculating the running standard deviation of the ATR, and then looking at that in relation to its recent low to find a filtering factor to use on the choppiness index. This makes the choppiness index more reactive to trends, but also slightly more likely to missidentify ranges.
This is the bar color version of the indicator. It changes the color of the bars when it it thinks the market is ranging and when it thinks it is trending.
Yellow = Trending
Transparent gray = Ranging