INVITE-ONLY SCRIPT
已更新 Zeta Breakout
If I ask you what moves the price, most of you will say the same old answer: Demand & Supply
But who creates Demand & Supply? You or Me, the retailers? No. It is Big Institutions and Mutual Funds and Big Banks which create this demand and supply because the
share of retailers in Stock Market is so little it does not affect the price in a big way.
The Big Institutions, Mutual Funds, Big Banks or in some cases Governments, are collectively called Smart Money.
When Smart Money steps in, the previous levels of Support or Resistance are broken and then the up or down move starts which most probably goes a certain distance.
Now the Support or Resistance levels are not static, they are dynamic in nature and keep changing with the time.
How does this indicator work?
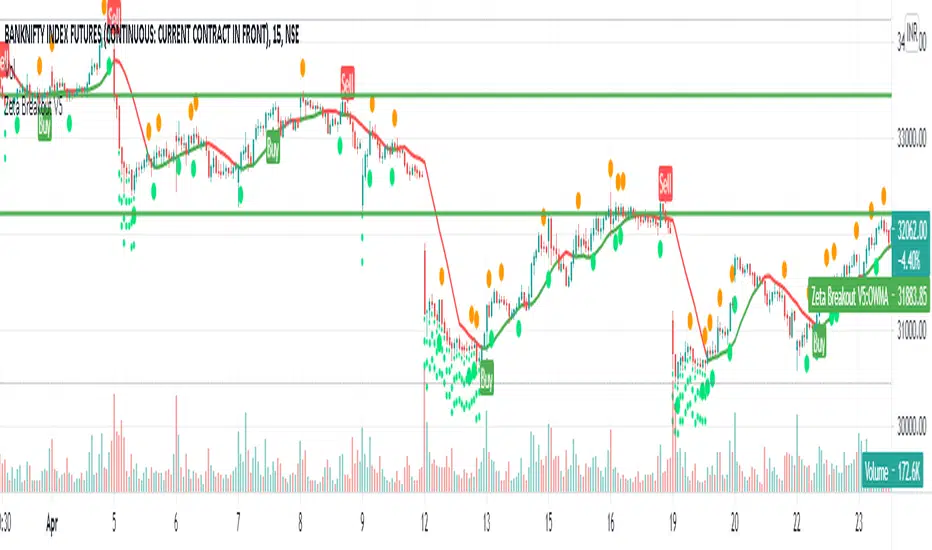
Zeta Breakout dynamically and automatically detects and marks these levels and when the price break-outs or break-downs or bounces up or down from these levels, the Buy or Sell Signals are generated for you to follow.
The indicator keeps watching previous or newly created levels of Support or Resistance and as soon as price crosses these levels or bounces from these levels, the user is alerted in the form of 'Buy' or 'Sell' Signals.
How to use this indicator?
1. When you see a Buy Signal, take Buy Position and hold it till either (a) You see opposite signal or (b) Your Stop Loss is hit which is ideally the low of candle preceding the signal candle or any other user defined SL. If your stop loss is hit and then price again starts moving in the same direction as indicated by the last Buy signal, take a fresh position as soon as the price crosses the level where previous signal is sitting.
2. When you see a Sell Signal, close your Buy Position, take a Sell position and hold it till either (a) You see opposite signal or (b) Your Stop Loss is hit which is ideally the high of candle preceding the signal candle or any user defined SL. If your stop loss is hit and then price again starts moving in the same direction as indicated by the last Sell signal, take a fresh position as soon as the price crosses the level where previous signal is sitting.
What are the target instruments/markets for this indicator?
This indicator can be used on Stocks, Indices, Gold , Silver , Currency Pairs, Crude Oil or anything being trades on any exchange in the world.
This indicator is not limited to any specific time-frame. You may select any time-frame which suits your trading style.
How can you get this indicator?
This is an invite-only paid indicator but we can give you FREE TRIAL for 05 days if you are interested.
For Free Trial, send a message to jellygill
But who creates Demand & Supply? You or Me, the retailers? No. It is Big Institutions and Mutual Funds and Big Banks which create this demand and supply because the
share of retailers in Stock Market is so little it does not affect the price in a big way.
The Big Institutions, Mutual Funds, Big Banks or in some cases Governments, are collectively called Smart Money.
When Smart Money steps in, the previous levels of Support or Resistance are broken and then the up or down move starts which most probably goes a certain distance.
Now the Support or Resistance levels are not static, they are dynamic in nature and keep changing with the time.
How does this indicator work?
Zeta Breakout dynamically and automatically detects and marks these levels and when the price break-outs or break-downs or bounces up or down from these levels, the Buy or Sell Signals are generated for you to follow.
The indicator keeps watching previous or newly created levels of Support or Resistance and as soon as price crosses these levels or bounces from these levels, the user is alerted in the form of 'Buy' or 'Sell' Signals.
How to use this indicator?
1. When you see a Buy Signal, take Buy Position and hold it till either (a) You see opposite signal or (b) Your Stop Loss is hit which is ideally the low of candle preceding the signal candle or any other user defined SL. If your stop loss is hit and then price again starts moving in the same direction as indicated by the last Buy signal, take a fresh position as soon as the price crosses the level where previous signal is sitting.
2. When you see a Sell Signal, close your Buy Position, take a Sell position and hold it till either (a) You see opposite signal or (b) Your Stop Loss is hit which is ideally the high of candle preceding the signal candle or any user defined SL. If your stop loss is hit and then price again starts moving in the same direction as indicated by the last Sell signal, take a fresh position as soon as the price crosses the level where previous signal is sitting.
What are the target instruments/markets for this indicator?
This indicator can be used on Stocks, Indices, Gold , Silver , Currency Pairs, Crude Oil or anything being trades on any exchange in the world.
This indicator is not limited to any specific time-frame. You may select any time-frame which suits your trading style.
How can you get this indicator?
This is an invite-only paid indicator but we can give you FREE TRIAL for 05 days if you are interested.
For Free Trial, send a message to jellygill
發行說明
Minor Tweakings done to nullify false breakouts.發行說明
Updated the code to remove some minor glitches which caused delayed detection in some cases.發行說明
Changed Settings which delayed Alert Trigger.發行說明
Updated settings to get little earlier signals.發行說明
Vastly improved code which is faster, more efficient and gives less number of signals.發行說明
Much Improved code which gives more trades by detecting faster Direction Changes.發行說明
Updated Version Number僅限邀請腳本
僅作者批准的使用者才能訪問此腳本。您需要申請並獲得使用許可,通常需在付款後才能取得。更多詳情,請依照作者以下的指示操作,或直接聯絡jellygill。
TradingView不建議在未完全信任作者並了解其運作方式的情況下購買或使用腳本。您也可以在我們的社群腳本中找到免費的開源替代方案。
作者的說明
As a benchmark, we tested the code on Bank Nifty. The tested time-frames are 5 min. 10 min. 15 min. 30 min. 01 hour. 02 hour and daily candle.
It works well in all these time frames
To avail FREE TRIAL for all our invite-only indicators, please contact us:
Telegram: @jellygill
Our Telegram Channel: @CheetaTrader
join to complete FREE TRAINING on how to use the indicators effectively and then request @jellygill for FREE TRIAL
Telegram: @jellygill
Our Telegram Channel: @CheetaTrader
join to complete FREE TRAINING on how to use the indicators effectively and then request @jellygill for FREE TRIAL
免責聲明
這些資訊和出版物並非旨在提供,也不構成TradingView提供或認可的任何形式的財務、投資、交易或其他類型的建議或推薦。請閱讀使用條款以了解更多資訊。
僅限邀請腳本
僅作者批准的使用者才能訪問此腳本。您需要申請並獲得使用許可,通常需在付款後才能取得。更多詳情,請依照作者以下的指示操作,或直接聯絡jellygill。
TradingView不建議在未完全信任作者並了解其運作方式的情況下購買或使用腳本。您也可以在我們的社群腳本中找到免費的開源替代方案。
作者的說明
As a benchmark, we tested the code on Bank Nifty. The tested time-frames are 5 min. 10 min. 15 min. 30 min. 01 hour. 02 hour and daily candle.
It works well in all these time frames
To avail FREE TRIAL for all our invite-only indicators, please contact us:
Telegram: @jellygill
Our Telegram Channel: @CheetaTrader
join to complete FREE TRAINING on how to use the indicators effectively and then request @jellygill for FREE TRIAL
Telegram: @jellygill
Our Telegram Channel: @CheetaTrader
join to complete FREE TRAINING on how to use the indicators effectively and then request @jellygill for FREE TRIAL
免責聲明
這些資訊和出版物並非旨在提供,也不構成TradingView提供或認可的任何形式的財務、投資、交易或其他類型的建議或推薦。請閱讀使用條款以了解更多資訊。