OPEN-SOURCE SCRIPT
Zero Lag LSMA 3-Color
# Zero Lag LSMA 3-Color Indicator
## Overview
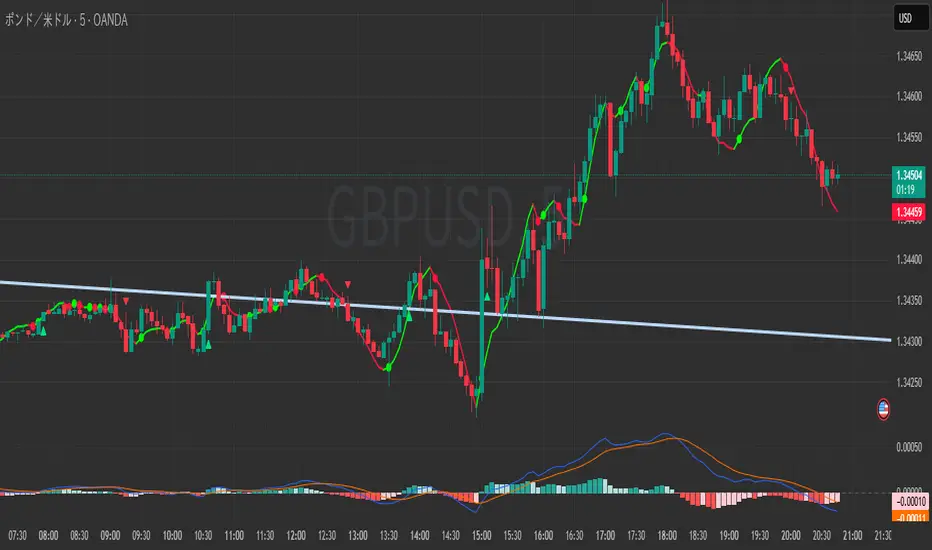
The Zero Lag LSMA (ZLSMA) 3-Color is an advanced trend-following indicator that reduces the lag inherent in traditional Linear Regression Moving Averages (LSMA). This indicator provides clear visual signals through a color-coded system and dot markers to identify trend changes with minimal delay.
## What is Zero Lag LSMA?
Zero Lag LSMA is calculated by applying the Linear Regression Moving Average twice and then compensating for the lag:
1. **First LSMA**: Calculate LSMA of the price data
2. **Second LSMA**: Calculate LSMA of the first LSMA
3. **Zero Lag Calculation**: ZLSMA = LSMA + (LSMA - LSMA2)
This method significantly reduces the delay while maintaining the smoothness of the trend line.
## Features
### Color-Coded Trend System
- **Fluorescent Green** (`RGB(0, 255, 0)`): Uptrend - ZLSMA is rising
- **Fluorescent Red** (`RGB(255, 20, 60)`): Downtrend - ZLSMA is falling
- **Gray**: Sideways/Neutral - No clear directional bias
### Trend Change Markers
- **Tiny dots** appear at the exact moment when the trend direction changes
- **Green dots**: Mark the beginning of an uptrend
- **Red dots**: Mark the beginning of a downtrend
### Customizable Parameters
- **Length**: Period for ZLSMA calculation (default: 20)
- **Line Width**: Thickness of the ZLSMA line (default: 2)
- **Show/Hide Toggle**: Option to display or hide the indicator
## Trading Applications
### Trend Identification
- **Green line**: Look for long opportunities
- **Red line**: Look for short opportunities
- **Gray line**: Consider range-bound strategies
### Entry Signals
- **Dot markers** provide precise entry points when trend changes occur
- Green dots can signal potential buy entries
- Red dots can signal potential sell entries
### Trend Confirmation
- Use ZLSMA color changes to confirm other technical analysis signals
- The reduced lag helps traders enter trends earlier than traditional moving averages
## Advantages Over Traditional Moving Averages
1. **Reduced Lag**: Responds faster to price changes than standard moving averages
2. **Clear Visualization**: Color-coding makes trend direction immediately apparent
3. **Precise Timing**: Dot markers highlight exact trend change moments
4. **Smooth Operation**: Maintains smoothness while reducing whipsaws
## Best Practices
### Timeframe Usage
- Works effectively on all timeframes
- Higher timeframes provide more reliable signals
- Lower timeframes offer more trading opportunities but may have more noise
### Risk Management
- Always use proper stop-loss levels
- Consider the overall market context
- Combine with other technical analysis tools for confirmation
### Settings Optimization
- **Shorter periods** (10-15): More sensitive, faster signals
- **Longer periods** (25-50): More stable, fewer false signals
- **Standard period** (20): Good balance between sensitivity and stability
## Alert Conditions
The indicator includes built-in alert conditions for:
- ZLSMA turning upward (trend change to bullish)
- ZLSMA turning downward (trend change to bearish)
## Compatibility
- **Platform**: TradingView
- **Script Version**: Pine Script v6
- **Chart Type**: Works on all chart types
- **Markets**: Suitable for Forex, Stocks, Crypto, Commodities, and Indices
## Disclaimer
This indicator is for educational and informational purposes only. It should not be considered as financial advice. Always conduct your own research and consider your risk tolerance before making trading decisions. Past performance does not guarantee future results.
## Overview
The Zero Lag LSMA (ZLSMA) 3-Color is an advanced trend-following indicator that reduces the lag inherent in traditional Linear Regression Moving Averages (LSMA). This indicator provides clear visual signals through a color-coded system and dot markers to identify trend changes with minimal delay.
## What is Zero Lag LSMA?
Zero Lag LSMA is calculated by applying the Linear Regression Moving Average twice and then compensating for the lag:
1. **First LSMA**: Calculate LSMA of the price data
2. **Second LSMA**: Calculate LSMA of the first LSMA
3. **Zero Lag Calculation**: ZLSMA = LSMA + (LSMA - LSMA2)
This method significantly reduces the delay while maintaining the smoothness of the trend line.
## Features
### Color-Coded Trend System
- **Fluorescent Green** (`RGB(0, 255, 0)`): Uptrend - ZLSMA is rising
- **Fluorescent Red** (`RGB(255, 20, 60)`): Downtrend - ZLSMA is falling
- **Gray**: Sideways/Neutral - No clear directional bias
### Trend Change Markers
- **Tiny dots** appear at the exact moment when the trend direction changes
- **Green dots**: Mark the beginning of an uptrend
- **Red dots**: Mark the beginning of a downtrend
### Customizable Parameters
- **Length**: Period for ZLSMA calculation (default: 20)
- **Line Width**: Thickness of the ZLSMA line (default: 2)
- **Show/Hide Toggle**: Option to display or hide the indicator
## Trading Applications
### Trend Identification
- **Green line**: Look for long opportunities
- **Red line**: Look for short opportunities
- **Gray line**: Consider range-bound strategies
### Entry Signals
- **Dot markers** provide precise entry points when trend changes occur
- Green dots can signal potential buy entries
- Red dots can signal potential sell entries
### Trend Confirmation
- Use ZLSMA color changes to confirm other technical analysis signals
- The reduced lag helps traders enter trends earlier than traditional moving averages
## Advantages Over Traditional Moving Averages
1. **Reduced Lag**: Responds faster to price changes than standard moving averages
2. **Clear Visualization**: Color-coding makes trend direction immediately apparent
3. **Precise Timing**: Dot markers highlight exact trend change moments
4. **Smooth Operation**: Maintains smoothness while reducing whipsaws
## Best Practices
### Timeframe Usage
- Works effectively on all timeframes
- Higher timeframes provide more reliable signals
- Lower timeframes offer more trading opportunities but may have more noise
### Risk Management
- Always use proper stop-loss levels
- Consider the overall market context
- Combine with other technical analysis tools for confirmation
### Settings Optimization
- **Shorter periods** (10-15): More sensitive, faster signals
- **Longer periods** (25-50): More stable, fewer false signals
- **Standard period** (20): Good balance between sensitivity and stability
## Alert Conditions
The indicator includes built-in alert conditions for:
- ZLSMA turning upward (trend change to bullish)
- ZLSMA turning downward (trend change to bearish)
## Compatibility
- **Platform**: TradingView
- **Script Version**: Pine Script v6
- **Chart Type**: Works on all chart types
- **Markets**: Suitable for Forex, Stocks, Crypto, Commodities, and Indices
## Disclaimer
This indicator is for educational and informational purposes only. It should not be considered as financial advice. Always conduct your own research and consider your risk tolerance before making trading decisions. Past performance does not guarantee future results.
開源腳本
秉持TradingView一貫精神,這個腳本的創作者將其設為開源,以便交易者檢視並驗證其功能。向作者致敬!您可以免費使用此腳本,但請注意,重新發佈代碼需遵守我們的社群規範。
免責聲明
這些資訊和出版物並非旨在提供,也不構成TradingView提供或認可的任何形式的財務、投資、交易或其他類型的建議或推薦。請閱讀使用條款以了解更多資訊。
免責聲明
這些資訊和出版物並非旨在提供,也不構成TradingView提供或認可的任何形式的財務、投資、交易或其他類型的建議或推薦。請閱讀使用條款以了解更多資訊。