OPEN-SOURCE SCRIPT
已更新 ATR / Price Ratio
Description:
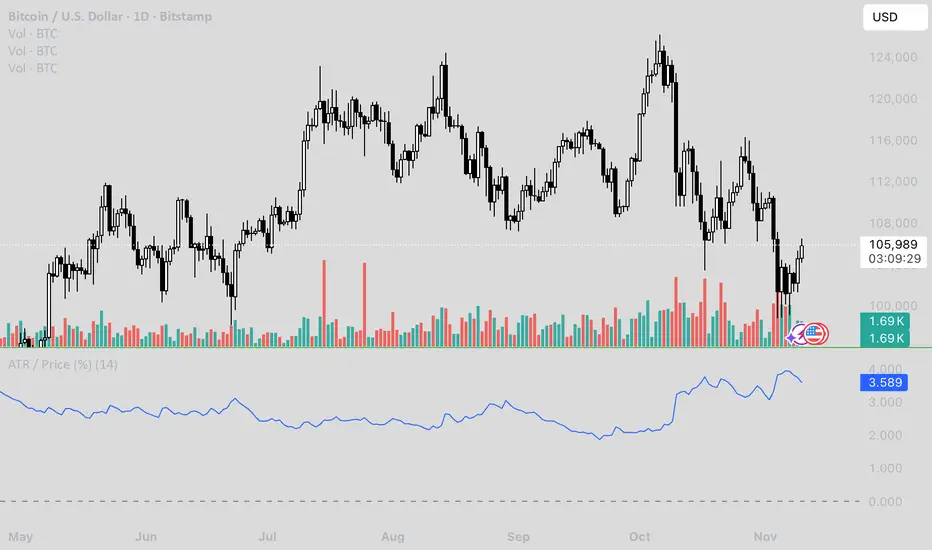
This indicator plots the ratio of the Average True Range (ATR) to the current price, showing volatility as a percentage of price rather than in absolute terms. It helps compare volatility across assets and timeframes by normalizing for price level.
A higher ATR/Price ratio means the market is moving a larger percentage of its value each bar (high relative volatility). A lower ratio indicates tighter, quieter price action (low relative volatility).
Traders can use this ratio to:
• Compare volatility between instruments
• Identify shifts into high or low volatility regimes
• Adjust position sizing and stop distances relative to risk
發行說明
Description:This indicator plots the ratio of the Average True Range (ATR) to the current price, showing volatility as a percentage of price rather than in absolute terms. It helps compare volatility across assets and timeframes by normalizing for price level.
A higher ATR/Price ratio means the market is moving a larger percentage of its value each bar (high relative volatility). A lower ratio indicates tighter, quieter price action (low relative volatility).
Traders can use this ratio to:
• Compare volatility between instruments
• Identify shifts into high or low volatility regimes
• Adjust position sizing and stop distances relative to risk
開源腳本
秉持TradingView一貫精神,這個腳本的創作者將其設為開源,以便交易者檢視並驗證其功能。向作者致敬!您可以免費使用此腳本,但請注意,重新發佈代碼需遵守我們的社群規範。
免責聲明
這些資訊和出版物並非旨在提供,也不構成TradingView提供或認可的任何形式的財務、投資、交易或其他類型的建議或推薦。請閱讀使用條款以了解更多資訊。
開源腳本
秉持TradingView一貫精神,這個腳本的創作者將其設為開源,以便交易者檢視並驗證其功能。向作者致敬!您可以免費使用此腳本,但請注意,重新發佈代碼需遵守我們的社群規範。
免責聲明
這些資訊和出版物並非旨在提供,也不構成TradingView提供或認可的任何形式的財務、投資、交易或其他類型的建議或推薦。請閱讀使用條款以了解更多資訊。