INVITE-ONLY SCRIPT
DiNapoli Oscillator Predictor
已更新

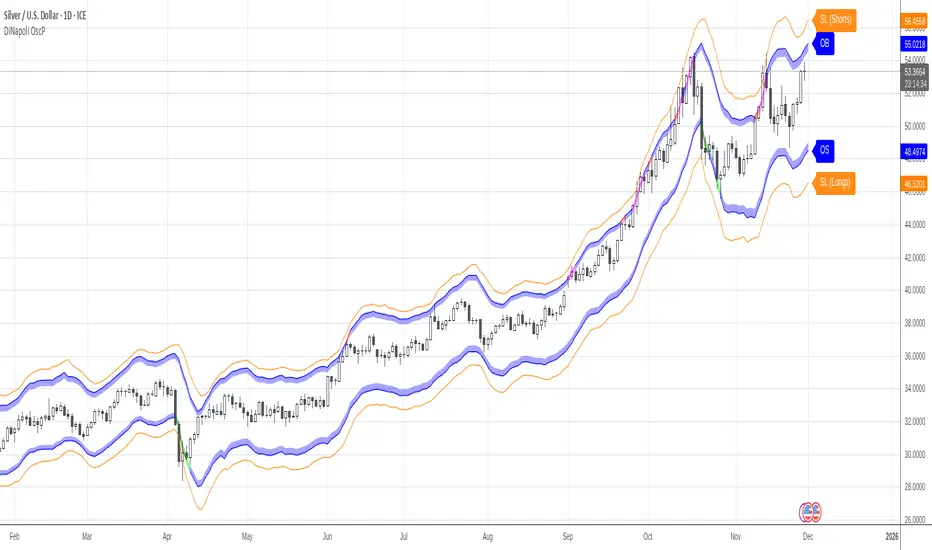
Oscillator Predictor is a useful indicator that paints dynamic OverBought and OverSold levels which are unknown to most of traders.
This version of the indicator includes the following options:
This indicator is meant to be used by a private group of traders.
If you would like to subscribe, send me a private message.
This version of the indicator includes the following options:
- Ability to show/hide OB/OS levels independently
- Ability to show/hide preceding OB/OS clouds
- Option to declutter the chart and draw the line only during last candles
- Allows custom setting of the oscillation period
- Allows customization of OB/OS trigger levels
- Displays safe suggestion to place Stop Loss levels
- Show/hide line tags
This indicator is meant to be used by a private group of traders.
If you would like to subscribe, send me a private message.
發行說明
Improved Custom TradingView Alerts. Now it is possible to get alerts on:- OverBought Condition
- Entering OverBought Condition
- Exiting OverBought Condition
- OverSold Condition
- Entering OverSold Condition
- Exiting OverSold Condition
發行說明
Added Features:- Ability to plot the midline
- Ability to base the study in a custom number (look-back period)
- Recent mode plots only in last 20 candles
- Recent mode plots the preceding OB/OS cloud
發行說明
- Improved accuracy. The Oscillator Predictor has improved in its responsiveness towards price data.
- Predictor parameters are now fully open for customization.
- Overbought and Oversold trigger lines can be adjusted in percentage terms (i.e. 80%, 100% or 110%).
- Ability to plot the Predictor in multiple timeframes.
- Simpler and more organized Input Tab.
- Added informative tooltips to the main parameters.
- Internal code updates.
發行說明
- To avoid misreadings when plotting the indicator from a custom timeframe, the label automatically gets displayed informing about that fact. This feature can be deactivated by unchecking the field "Force Label on Custom Timeframe".
- All colors are customizable through the Input Tab, including lines, labels and text colors.
- Input Tab reorganization.
僅限邀請腳本
僅限作者授權的用戶訪問此腳本,並且通常需要付費。您可以將其增加到收藏腳本中,但是只有在向作者請求並獲得許可之後,才能使用它。 請聯繫gliderfund以了解更多信息,或按照下面作者的說明進行操作。
TradingView 不建議購買並使用此腳本,除非您 100% 信任其作者並了解腳本的工作原理。在許多情況下,您可以在我們的社群腳本中免費找到良好的開源替代方案。
作者的說明
″If you'd like to subscribe to this indicator, please send me a Private Message.
想在圖表上使用此腳本?
警告:請閱讀,然後再請求訪問權限。
I develop indicators meant to be useful, profitable and good looking.
免責聲明
這些資訊和出版物並不意味著也不構成TradingView提供或認可的金融、投資、交易或其他類型的意見或建議。請在使用條款閱讀更多資訊。