INVITE-ONLY SCRIPT
FIBAUS Noodler V6
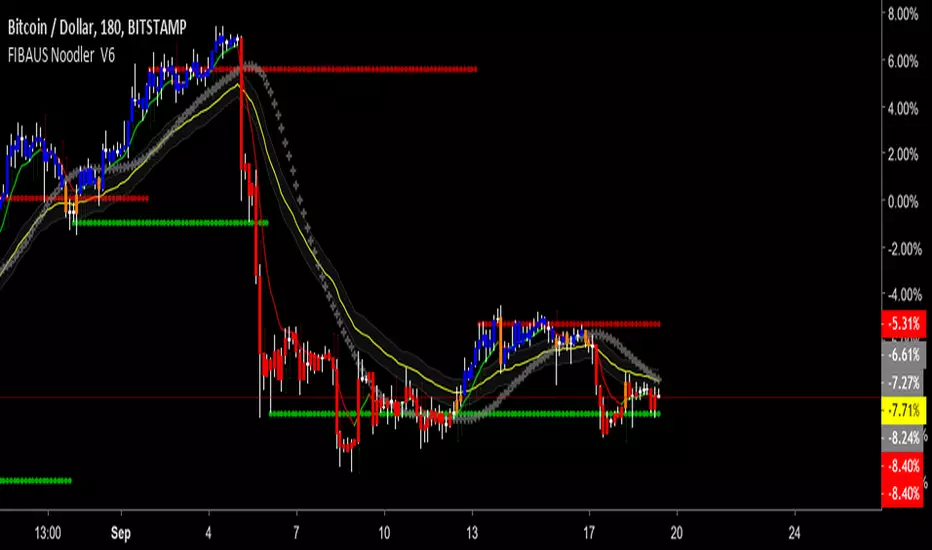
Named by my daughter, because of its early look like a bowl of noodles,the noodle analysis does a Harmonic and Fibonacci Analysis on price as it moves through time.
FEATURES
1.RESISTANCE AND SUPPORT - Finds Hidden and Fibonacci based R&S Levels, to assist with buying and selling targets.
2.SENTIMENT INDICATOR-A measure of human confidence and fear as it relates to price.
3.BANKERS GOLDEN NOODLE - A very specific institutional (banks, investment firms etc) calculation.
4.COLORED BARS - To show uptrend, uncertainty and downtrend.
Blue - Up-Trend/Breakout -(BUY/LONG)
Orange - Potential Trend reversal
Red - Downtrend (SELL/SHORT)
5.ALL markets anytime timeframe-(stocks, crypto, forex, futures ) application
FOR TRIAL ACCESS - 1. Follow me, 2. Like the script 3. Message me the words “I WANT IN NOW”.
BUY SIGNALS - 1.When Rapid Price Direction line crosses up the Sentiment Indicator
2.When Rapid Price Direction line crosses up the Bankers Golden Noodle
3. Candles Turn From Orange to Blue
SELL SIGNALS - 1.When Rapid Price Direction line crosses down the Sentiment Indicator
2.When Rapid Price Direction line crosses down the Bankers Golden
Noodle.
3. Candles Turn From Orange to RED
PRO Tips: 1. Remove candle borders for better visual of colored candles.
2. Make the Sentiment Line Transparent for less color on the chart
(Step 1:Double click on the script after applied to chart)
(Step 2:Click Inputs at the top of the menu and check the Color box)
3. Two more PRO BUY and SELL Techniques for free private chat members only.
FOR TRIAL ACCESS - 1. Follow me, 2. Like the script 3. Message me the words “I WANT IN NOW”
Happy Trading,
FIBAUS
僅限邀請腳本
僅作者批准的使用者才能訪問此腳本。您需要申請並獲得使用許可,通常需在付款後才能取得。更多詳情,請依照作者以下的指示操作,或直接聯絡fibonacciaustrian。
TradingView不建議在未完全信任作者並了解其運作方式的情況下購買或使用腳本。您也可以在我們的社群腳本中找到免費的開源替代方案。
作者的說明
免責聲明
這些資訊和出版物並非旨在提供,也不構成TradingView提供或認可的任何形式的財務、投資、交易或其他類型的建議或推薦。請閱讀使用條款以了解更多資訊。
僅限邀請腳本
僅作者批准的使用者才能訪問此腳本。您需要申請並獲得使用許可,通常需在付款後才能取得。更多詳情,請依照作者以下的指示操作,或直接聯絡fibonacciaustrian。
TradingView不建議在未完全信任作者並了解其運作方式的情況下購買或使用腳本。您也可以在我們的社群腳本中找到免費的開源替代方案。
作者的說明
免責聲明
這些資訊和出版物並非旨在提供,也不構成TradingView提供或認可的任何形式的財務、投資、交易或其他類型的建議或推薦。請閱讀使用條款以了解更多資訊。