OPEN-SOURCE SCRIPT
已更新 Wolf EMA & OHL & SIGNALS
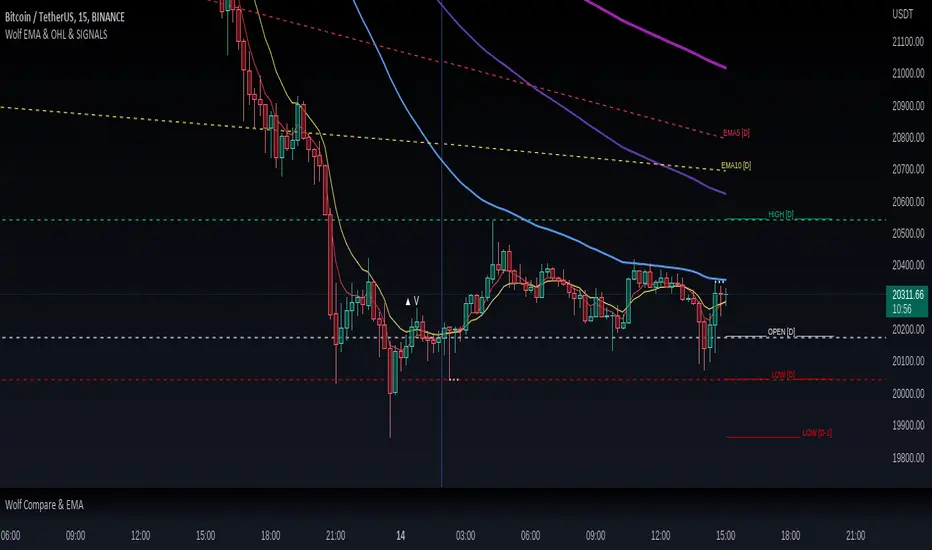
Wolf EMA & OHL & SIGNALS
this indicator is mainly used for fast trading techniques (scalping). provides various tools for comprehensive trend analysis.
5 EMAs are used to have possible market entry or exit signals.
EMA

Thanks to the combination of the EMAs of different timeframes,
you can immediately get an idea of the resistances or supports
of the higher timeframes.
HOL
Lines are drawn on the right side indicating the maximum, minimum and opening
of the day, past day, week and past week respectively.
These levels are excellent as price acceleration points.
SIGNALS
There are three types of signals that are monitored by this indicator:
- Shimano

This signal is generated if the price remains compressed between two EMAs, more precisely between the third and the fifth, at the point where the price breaks one of these EMAs there can be a strong price movement.
- Viagra

This signal is generated if the price remains below the second EMA for a long time without ever closing above / below, at the point where it closes by climbing over the EMA there may be a change in trend.
-Bud

This signal is generated if a positive candle is formed and subsequently at least two that close within the high and low of the positive candle. Where the price breaks through the high of the positive candle is a great entry point.
this indicator is mainly used for fast trading techniques (scalping). provides various tools for comprehensive trend analysis.
5 EMAs are used to have possible market entry or exit signals.
EMA
Thanks to the combination of the EMAs of different timeframes,
you can immediately get an idea of the resistances or supports
of the higher timeframes.
HOL
Lines are drawn on the right side indicating the maximum, minimum and opening
of the day, past day, week and past week respectively.
These levels are excellent as price acceleration points.
SIGNALS
There are three types of signals that are monitored by this indicator:
- Shimano
This signal is generated if the price remains compressed between two EMAs, more precisely between the third and the fifth, at the point where the price breaks one of these EMAs there can be a strong price movement.
- Viagra
This signal is generated if the price remains below the second EMA for a long time without ever closing above / below, at the point where it closes by climbing over the EMA there may be a change in trend.
-Bud
This signal is generated if a positive candle is formed and subsequently at least two that close within the high and low of the positive candle. Where the price breaks through the high of the positive candle is a great entry point.
發行說明
- add auto EMA timeframe 3m- bug fix EMA timeframe 4h
發行說明
Update layout input panel發行說明
change all automatic EMA on a daily basis.add alert EMA 10
fix bug alert EMA9
發行說明
comment EMA 10 for bug over 200發行說明
Add signal BUD for SHORT 發行說明
- Add "Crossing" and "Anti-crossing" signal- Add auto drawing lines (High - Open - Low) if the percentage is less than 2%
發行說明
Correction de bogues EMA Daily發行說明
Add set show MA and MA Day發行說明
Add set style MA Daily and improved settings panel開源腳本
秉持TradingView一貫精神,這個腳本的創作者將其設為開源,以便交易者檢視並驗證其功能。向作者致敬!您可以免費使用此腳本,但請注意,重新發佈代碼需遵守我們的社群規範。
免責聲明
這些資訊和出版物並非旨在提供,也不構成TradingView提供或認可的任何形式的財務、投資、交易或其他類型的建議或推薦。請閱讀使用條款以了解更多資訊。
免責聲明
這些資訊和出版物並非旨在提供,也不構成TradingView提供或認可的任何形式的財務、投資、交易或其他類型的建議或推薦。請閱讀使用條款以了解更多資訊。