OPEN-SOURCE SCRIPT
Relative Strength vs. Benchmark (相對強度)
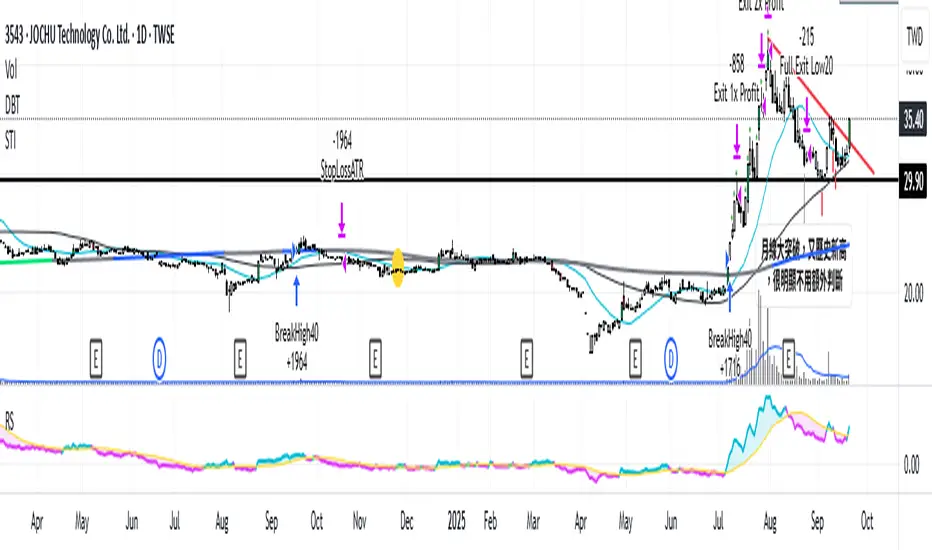
This "Relative Strength vs. Benchmark" indicator helps you see a stock's true performance against a benchmark (like the S&P 500) at a glance. By calculating the price ratio between the two, it strips away the overall market noise, allowing you to focus on identifying true market leaders and underperforming laggards.
How It Works
Core Formula: Relative Strength = Stock Price / Benchmark Index Price
A Rising Line: Means the stock is outperforming the benchmark.
A Falling Line: Means the stock is underperforming the benchmark.
The indicator also includes a Moving Average (MA) of the Relative Strength line itself. This MA helps to confirm the trend of relative strength and filter out short-term noise.
How to Use
Find Market Leaders: When the market is in an uptrend or consolidating, look for stocks whose RS line is breaking out to new highs.
Avoid Laggards: If the RS line is consistently below its moving average or making new lows, the stock is significantly underperforming the market and should be treated with caution.
Trend Change Signals: A cross of the RS line above its MA can be seen as a signal that a new trend of relative outperformance is beginning. A cross below suggests the trend is weakening.
Features & Settings
Customizable Benchmark: You can change the default benchmark from TWSE:TSE to any symbol you need, such as SP:SPX for the S&P 500 or NASDAQ:NDX for the Nasdaq 100.
Adjustable MA Length: Customize the period for the RS Moving Average to fit your trading style (short-term or long-term).
Visual Toggle: Easily turn the colored background fill on or off according to your preference.
Hope you find this tool helpful in your analysis!
開源腳本
秉持TradingView一貫精神,這個腳本的創作者將其設為開源,以便交易者檢視並驗證其功能。向作者致敬!您可以免費使用此腳本,但請注意,重新發佈代碼需遵守我們的社群規範。
RMS crypto screener
reurl.cc/33DLKX
reurl.cc/33DLKX
免責聲明
這些資訊和出版物並非旨在提供,也不構成TradingView提供或認可的任何形式的財務、投資、交易或其他類型的建議或推薦。請閱讀使用條款以了解更多資訊。
開源腳本
秉持TradingView一貫精神,這個腳本的創作者將其設為開源,以便交易者檢視並驗證其功能。向作者致敬!您可以免費使用此腳本,但請注意,重新發佈代碼需遵守我們的社群規範。
RMS crypto screener
reurl.cc/33DLKX
reurl.cc/33DLKX
免責聲明
這些資訊和出版物並非旨在提供,也不構成TradingView提供或認可的任何形式的財務、投資、交易或其他類型的建議或推薦。請閱讀使用條款以了解更多資訊。