OPEN-SOURCE SCRIPT
BBMan with EMAs
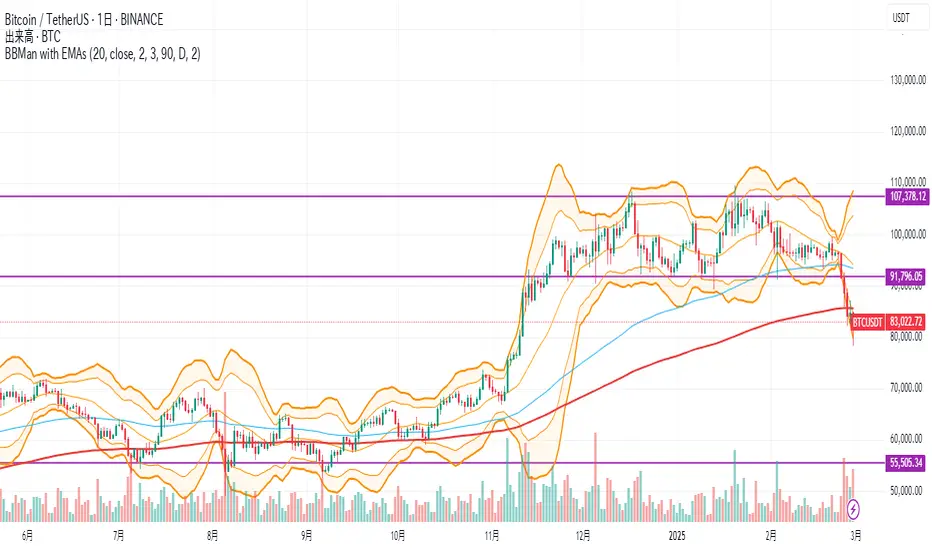
BBMan (Bollinger Bands Manager)
Created by: Hiroshi Yoshitaka
Website: cryptrader.net
Description:
A comprehensive Bollinger Bands indicator that combines standard deviation bands (2σ and 3σ) with key EMAs (100 and 200) for enhanced technical analysis. The indicator features customizable visual elements and flexible alert conditions.
Key Features:
- Dual Bollinger Bands (2σ and 3σ)
- EMA 100 and 200 overlay
- Customizable color scheme
- Advanced alert system
Components:
1. Bollinger Bands
- Center line (20-period SMA)
- 2σ bands (thinner lines)
- 3σ bands (thicker lines)
- Highlighted area between 2σ and 3σ
2. Moving Averages
- EMA 100 (medium-term trend)
- EMA 200 (long-term trend)
- Toggle option for EMA display
3. Alert System
- Customizable timeframe selection
- Choice between 2σ and 3σ band touches
- Price touch notifications
Visual Settings:
- Orange-based color scheme for bands
- Customizable transparency for highlighted areas
- Different line weights for 2σ and 3σ bands
- Distinct colors for EMAs (blue for 100, red for 200)
Use Cases:
- Volatility analysis
- Trend identification
- Support/resistance levels
- Overbought/oversold conditions
- Price reversal signals
The indicator is designed for traders who want a clean, professional view of price action relative to standard deviation bands while maintaining awareness of key moving averages.
開源腳本
秉持TradingView一貫精神,這個腳本的創作者將其設為開源,以便交易者檢視並驗證其功能。向作者致敬!您可以免費使用此腳本,但請注意,重新發佈代碼需遵守我們的社群規範。
免責聲明
這些資訊和出版物並非旨在提供,也不構成TradingView提供或認可的任何形式的財務、投資、交易或其他類型的建議或推薦。請閱讀使用條款以了解更多資訊。
開源腳本
秉持TradingView一貫精神,這個腳本的創作者將其設為開源,以便交易者檢視並驗證其功能。向作者致敬!您可以免費使用此腳本,但請注意,重新發佈代碼需遵守我們的社群規範。
免責聲明
這些資訊和出版物並非旨在提供,也不構成TradingView提供或認可的任何形式的財務、投資、交易或其他類型的建議或推薦。請閱讀使用條款以了解更多資訊。