OPEN-SOURCE SCRIPT
MultiTFlevels with Volume Display
1. Overview
This indicator is intended for use on trading platforms like TradingView and provides the following features:
Volume Profile Analysis:
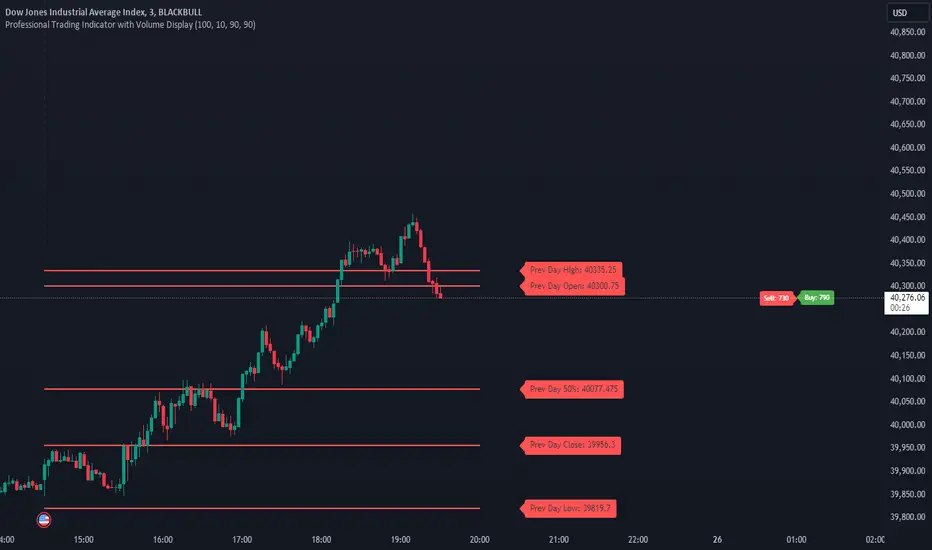
Shows cumulative volume delta (CVD) and displays buying and selling volumes.
Historical OHLC Levels:
Plots historical open, high, low, and close levels for various timeframes (e.g., daily, weekly, monthly).
Customizable Settings:
Allows users to toggle different elements and customize display options.
2. Inputs
Timeframe Display Toggles:
Users can choose to display OHLC levels from different timeframes such as previous month, week, day, 4H, 1H, 30M, 15M, and 5M.
CVD Display Toggle: Option to show or hide the Cumulative Volume Delta (CVD).
Line and Label Customization:
leftOffset and rightOffset: Define how far lines are extended left and right from the current bar.
colorMonth, colorWeek, etc.: Customize colors for different timeframe OHLC levels.
labelOffset and rightOffset: Control the positioning of volume labels.
3. Key Features
Cumulative Volume Delta (CVD)
Calculation:
Computes the cumulative volume delta by adding or subtracting the volume based on whether the close price is higher or lower than the open price.
Display:
Shows a label on the chart indicating the current CVD value and whether the market is leaning towards buying or selling.
Historical OHLC Levels
Data Retrieval:
Uses the request.security function to fetch OHLC data from different timeframes (e.g., monthly, weekly, daily).
Plotting:
Draws lines and labels on the chart to represent open, high, low, and close levels for each selected timeframe.
Buying and Selling Volumes
Calculation:
Calculates buying and selling volumes based on whether the close price is higher or lower than the open price.
Display:
Shows labels on the chart for buying and selling volumes.
4. Functions
getOHLC(timeframe)
Retrieves open, high, low, and close values from the specified timeframe.
plotOHLC(show, open, high, low, close, col, prefix)
Draws OHLC lines and labels on the chart for the given timeframe and color.
5. Usage
Chart Overlay: The indicator is overlaid on the main chart (i.e., it appears directly on the price chart).
Historical Analysis:
Useful for analyzing historical price levels and volume dynamics across different timeframes.
Volume Insights:
Helps traders understand the cumulative volume behavior and market sentiment through the CVD and volume labels.
In essence, this indicator provides a comprehensive view of historical price levels across multiple timeframes and the dynamics of market volume through CVD and volume labels. It can be particularly useful for traders looking to combine price action with volume analysis for a more in-depth market assessment.
This indicator is intended for use on trading platforms like TradingView and provides the following features:
Volume Profile Analysis:
Shows cumulative volume delta (CVD) and displays buying and selling volumes.
Historical OHLC Levels:
Plots historical open, high, low, and close levels for various timeframes (e.g., daily, weekly, monthly).
Customizable Settings:
Allows users to toggle different elements and customize display options.
2. Inputs
Timeframe Display Toggles:
Users can choose to display OHLC levels from different timeframes such as previous month, week, day, 4H, 1H, 30M, 15M, and 5M.
CVD Display Toggle: Option to show or hide the Cumulative Volume Delta (CVD).
Line and Label Customization:
leftOffset and rightOffset: Define how far lines are extended left and right from the current bar.
colorMonth, colorWeek, etc.: Customize colors for different timeframe OHLC levels.
labelOffset and rightOffset: Control the positioning of volume labels.
3. Key Features
Cumulative Volume Delta (CVD)
Calculation:
Computes the cumulative volume delta by adding or subtracting the volume based on whether the close price is higher or lower than the open price.
Display:
Shows a label on the chart indicating the current CVD value and whether the market is leaning towards buying or selling.
Historical OHLC Levels
Data Retrieval:
Uses the request.security function to fetch OHLC data from different timeframes (e.g., monthly, weekly, daily).
Plotting:
Draws lines and labels on the chart to represent open, high, low, and close levels for each selected timeframe.
Buying and Selling Volumes
Calculation:
Calculates buying and selling volumes based on whether the close price is higher or lower than the open price.
Display:
Shows labels on the chart for buying and selling volumes.
4. Functions
getOHLC(timeframe)
Retrieves open, high, low, and close values from the specified timeframe.
plotOHLC(show, open, high, low, close, col, prefix)
Draws OHLC lines and labels on the chart for the given timeframe and color.
5. Usage
Chart Overlay: The indicator is overlaid on the main chart (i.e., it appears directly on the price chart).
Historical Analysis:
Useful for analyzing historical price levels and volume dynamics across different timeframes.
Volume Insights:
Helps traders understand the cumulative volume behavior and market sentiment through the CVD and volume labels.
In essence, this indicator provides a comprehensive view of historical price levels across multiple timeframes and the dynamics of market volume through CVD and volume labels. It can be particularly useful for traders looking to combine price action with volume analysis for a more in-depth market assessment.
開源腳本
秉持TradingView一貫精神,這個腳本的創作者將其設為開源,以便交易者檢視並驗證其功能。向作者致敬!您可以免費使用此腳本,但請注意,重新發佈代碼需遵守我們的社群規範。
免責聲明
這些資訊和出版物並非旨在提供,也不構成TradingView提供或認可的任何形式的財務、投資、交易或其他類型的建議或推薦。請閱讀使用條款以了解更多資訊。
開源腳本
秉持TradingView一貫精神,這個腳本的創作者將其設為開源,以便交易者檢視並驗證其功能。向作者致敬!您可以免費使用此腳本,但請注意,重新發佈代碼需遵守我們的社群規範。
免責聲明
這些資訊和出版物並非旨在提供,也不構成TradingView提供或認可的任何形式的財務、投資、交易或其他類型的建議或推薦。請閱讀使用條款以了解更多資訊。