OPEN-SOURCE SCRIPT
Double Daddy

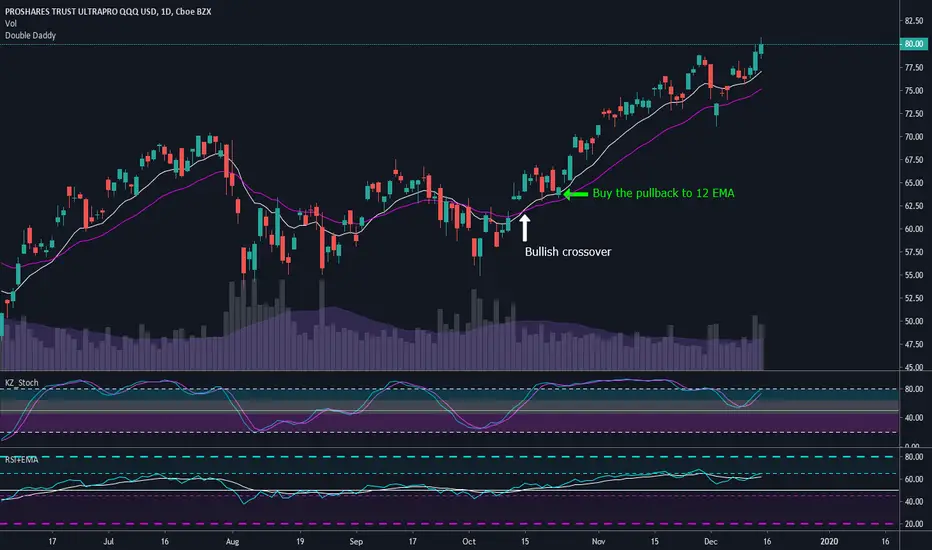
This is a super simple strategy that I use when I miss an entry based on other indicators, or if I've been on a losing streak and I need an easy win. Wait for the 12 EMA to cross above the 26 EMA, and then buy when price pulls back to the 12 or 26 EMA. I prefer to exit my trades based off divergence on the stochastics or RSI, but if you miss that exit then wait for the 12 to cross below the 26 and sell when price to pulls back up to the 12 EMA.
I find this strategy works well on the daily time frame in traditional markets, and for Bitcoin it works well for 6 hour and daily time frames.
Moving averages are lagging indicators so this strategy does not work well in choppy markets or when you have a deep V bottom or blow off top. I only use this strategy when there is a confirmed weekly uptrend.
開源腳本
In true TradingView spirit, the creator of this script has made it open-source, so that traders can review and verify its functionality. Kudos to the author! While you can use it for free, remember that republishing the code is subject to our House Rules.
免責聲明
The information and publications are not meant to be, and do not constitute, financial, investment, trading, or other types of advice or recommendations supplied or endorsed by TradingView. Read more in the Terms of Use.