OPEN-SOURCE SCRIPT
已更新 First 1-Minute Candle High/Low After Specific Time
Description:
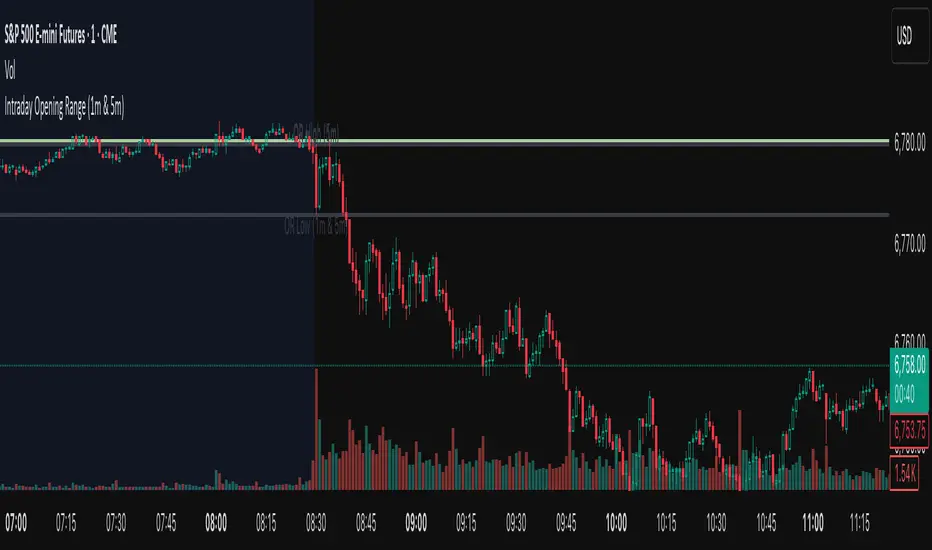
This indicator captures and marks the high and low of the first 1-minute candle after a specified time (default: 9:30 AM) and tracks the highs and lows of the first five candles. The levels marked by these initial candles are often critical in determining early session support and resistance, providing a visual guide for traders monitoring price action in the opening minutes of a trading session.
Key Features and Usage
1-Minute Candle High/Low: The indicator captures the high and low of the first 1-minute candle after the specified session start time. This level is marked with horizontal lines and labels, providing traders with an immediate reference for early-session price extremes.
5-Candle Range High/Low: After the first five candles, the indicator also highlights the highest and lowest levels within this range, offering additional support/resistance lines to aid in understanding early price movements.
Custom Labels and Dynamic Line Extension:
Labels update dynamically and display whether the 1-minute high/low coincides with the 5-minute range high/low, combining these labels if they match.
Horizontal lines extend to the current bar to remain visible throughout the session for consistent reference.
Customization Options
Colors and Label Text: Users can adjust colors for the 1-minute and 5-minute high/low lines and the label text for optimal readability.
Label Position Offset: Labels are placed slightly above or below their respective lines to avoid overlap with price action, maintaining clarity on the chart.
Intended Use
This indicator is especially useful for intraday traders focusing on opening range breakout strategies, scalping, or short-term trend analysis. It is intended for use on intraday charts (such as 1-minute or 5-minute intervals) and provides straightforward levels to assess early market structure.
Technical Details
Customization of Start Time: Users can change the default start time to any desired session opening time, adapting it to various markets or trading sessions.
Dynamic Line and Label Updates: Both lines and labels dynamically extend with the chart, while labels remain easy to read as they shift based on recent price action.
This script is designed to be simple yet powerful, offering key insights into session open levels without relying on predictive or lookahead features. It is useful for real-time analysis and adds value by helping traders identify critical levels in the market's early stages.
發行說明
Description:This indicator automatically plots the Opening Range (OR) highs and lows for both the 09:30 1-minute candle and the 09:30–09:35 5-minute range, aligned to the New York session with full DST-safe timezone handling.
• ✅ 1-Minute Opening Range (09:30–09:31)
• ✅ 5-Minute Opening Range (09:30–09:35)
• ✅ Lines extend across the chart for easy reference
• ✅ Labels clearly mark whether the level is from the 1m OR, 5m OR, or both if identical
• ✅ Session timezone is selectable (default: America/New_York)
Use this tool to quickly visualize intraday key levels that many traders use for breakout setups, pullback entries, and intraday bias. Works reliably on any timeframe chart.
開源腳本
秉持TradingView一貫精神,這個腳本的創作者將其設為開源,以便交易者檢視並驗證其功能。向作者致敬!您可以免費使用此腳本,但請注意,重新發佈代碼需遵守我們的社群規範。
免責聲明
這些資訊和出版物並非旨在提供,也不構成TradingView提供或認可的任何形式的財務、投資、交易或其他類型的建議或推薦。請閱讀使用條款以了解更多資訊。
免責聲明
這些資訊和出版物並非旨在提供,也不構成TradingView提供或認可的任何形式的財務、投資、交易或其他類型的建議或推薦。請閱讀使用條款以了解更多資訊。