OPEN-SOURCE SCRIPT
已更新 VWAP Multi-Timeframe
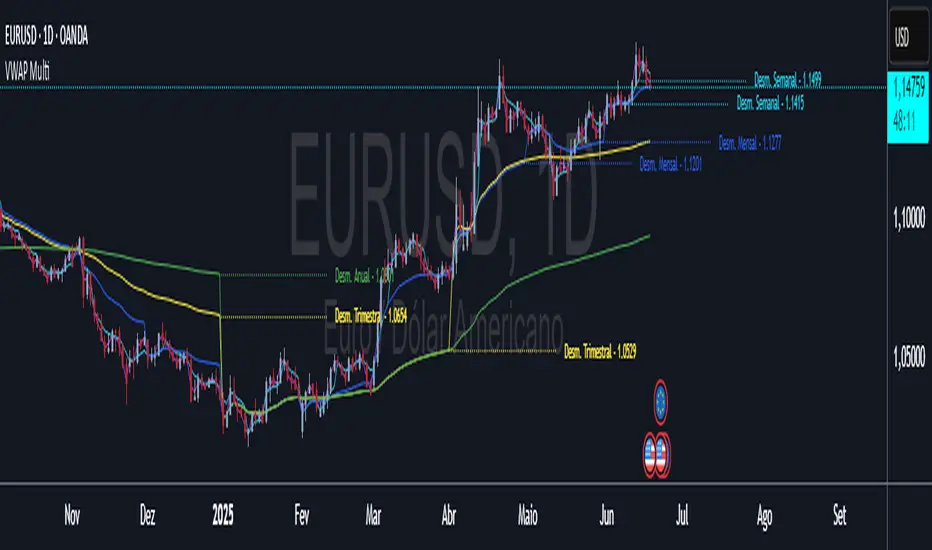
VWAP Multi-Timeframe - Complete Professional Indicator
🚀 WHAT IS IT?
The VWAP Multi-Timeframe is an advanced indicator that combines 5 different VWAP periods in a single tool, providing a complete view of market fair value levels across multiple time scales.
⭐ KEY FEATURES
📊 5 Configurable VWAPs:
🟡 Daily VWAP - Ideal for day trading and intraday operations
🟠 Weekly VWAP - Perfect for swing trading
🔵 Monthly VWAP - Excellent for medium-term analysis
🔴 Quarterly VWAP - Essential for quarterly strategies
🟢 Yearly VWAP - Fundamental for long-term investments
🎯 Multiple Price Sources:
Choose the source that best fits your strategy:
Close - Closing price (most common)
OHLC4 - Complete average (smoother)
HLC3 - Typical price (default)
HL2 - Period midpoint
Open/High/Low - Specific prices
💡 HOW TO USE
For Day Traders:
Use Daily VWAP as main fair value reference
Prices above = buying pressure / Prices below = selling pressure
For Swing Traders:
Combine Weekly and Monthly VWAP to identify trends
Look for confluences between different timeframes
For Investors:
Quarterly and Yearly VWAP show long-term value levels
Excellent for identifying entry points in investments
🔧 TECHNICAL FEATURES
✅ Pine Script v6 - Latest and optimized version
✅ Clean Interface - User-friendly design
發行說明
VWAP Multi-Timeframe with Smart Dismount SystemThis advanced VWAP indicator provides comprehensive multi-timeframe analysis with an innovative dismount tracking system that identifies key VWAP reset levels across different time periods.
🎯 Key Features:
Multi-Timeframe VWAP Analysis:
Daily, Weekly, Monthly, Quarterly, and Yearly VWAPs
Customizable price source (Close, Open, High, Low, HL2, HLC3, OHLC4)
Professional color-coded visualization
Smart Dismount System:
The unique dismount feature tracks and displays the last two VWAP reset levels for each timeframe, showing where institutional money flow patterns change. These dismount lines represent:
Daily: Current and previous day reset levels
Weekly: Current and previous week reset levels
Monthly: Current and previous month reset levels
Quarterly: Current and previous quarter reset levels
Yearly: Current and previous year reset levels
🔧 Advanced Customization:
Individual control for each timeframe's dismount visibility
Customizable line styles (Solid, Dashed, Dotted)
Adjustable line width and length
Color-coordinated dismount lines matching their respective VWAPs
Optional price labels with configurable font sizes
📊 Clean Interface:
VWAPs controlled via Style tab (visibility, colors, width)
Dismount settings organized in dedicated groups in Inputs tab
No duplicate controls - streamlined user experience
Maximum 10 dismount lines displayed (2 per timeframe) for clean charts
🎨 Professional Defaults:
Carefully selected color palette for optimal contrast
Dotted dismount lines for subtle reference without chart clutter
Compact 30-bar line length for relevant historical context
Small font labels for essential information display
💡 Trading Applications:
Identify key institutional support/resistance levels
Track VWAP reset points for entry/exit strategies
Analyze multi-timeframe confluence zones
Monitor institutional money flow pattern changes
Perfect for both scalping and swing trading strategies
⚙️ Technical Implementation:
Efficient array-based system stores only the most recent dismount levels
Optimized performance with minimal memory usage
Real-time calculation with confirmed bar detection
Compatible with all chart timeframes and instruments
This indicator is ideal for traders who need precise VWAP analysis combined with institutional level tracking across multiple timeframes. The dismount system provides unique insights into where significant market participants are likely to reassess their positions, making it an invaluable tool for modern algorithmic and institutional trading strategies.
開源腳本
秉持TradingView一貫精神,這個腳本的創作者將其設為開源,以便交易者檢視並驗證其功能。向作者致敬!您可以免費使用此腳本,但請注意,重新發佈代碼需遵守我們的社群規範。
免責聲明
這些資訊和出版物並非旨在提供,也不構成TradingView提供或認可的任何形式的財務、投資、交易或其他類型的建議或推薦。請閱讀使用條款以了解更多資訊。
開源腳本
秉持TradingView一貫精神,這個腳本的創作者將其設為開源,以便交易者檢視並驗證其功能。向作者致敬!您可以免費使用此腳本,但請注意,重新發佈代碼需遵守我們的社群規範。
免責聲明
這些資訊和出版物並非旨在提供,也不構成TradingView提供或認可的任何形式的財務、投資、交易或其他類型的建議或推薦。請閱讀使用條款以了解更多資訊。