OPEN-SOURCE SCRIPT
已更新 Gradient Range [BigBeluga]

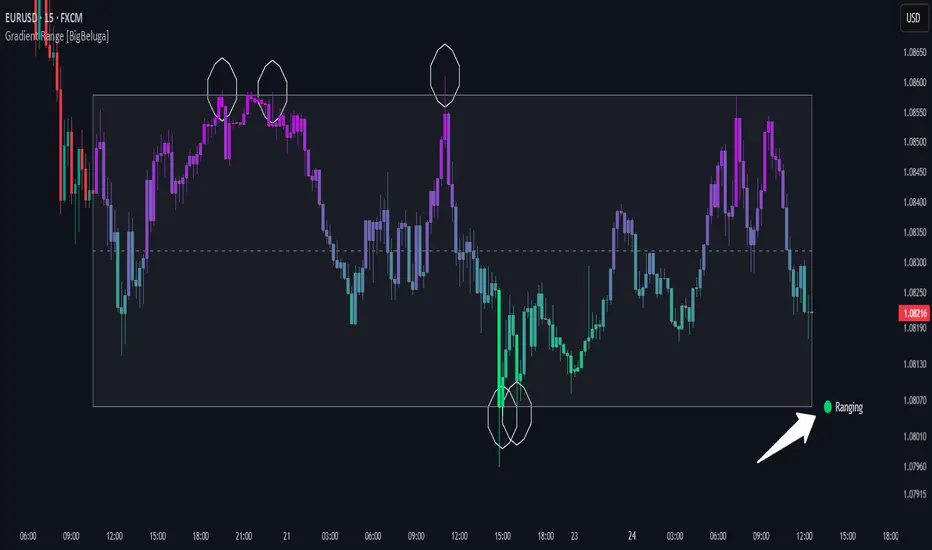
This indicator highlights range-bound market conditions by dynamically plotting gradient-colored candlesticks within a defined price box. It detects whether the market is ranging or trending using ADX and can identify mean reversion points when price steps outside the established range.
🔵KEY FEATURES:
- Range Detection Box:
➣ A transparent box is drawn based on the highest and lowest price close over a user-defined period.
➣ Helps visualize range boundaries and the midline for support/resistance reference. - Gradient Candlestick Coloring:
➣ Candles inside the range are colored with a gradient from top to bottom based on proximity to the midline.
➣ Top range candles are shaded with bearish tones, while bottom range candles use bullish tones. - Ranging/Trending State Detection:
➣ Uses ADX to determine if the market is currently in a ranging or trending state.
➣ A label in the bottom right corner shows a real-time status (🟢 Ranging / 🟡 Trending). - Mean Reversion Signal Circles:
➣ When the market is ranging, white circles are plotted at highs/lows that breach the box boundary, indicating potential mean reversion points.
➣ These levels can act as fade trade setups or exhaustion markers.
🔵USAGE:
- Range Trading: Trade between the upper and lower boundaries during range-bound conditions with clearer visual feedback.
- Mean Reversion Plays: Use circle signals as early alerts to identify when price extends beyond the range and may revert to the mean.
- Visual Trend Strength: Instantly recognize where price is concentrated inside the range via the color gradient system.
- Ranging Filter: Use the ADX label to avoid false setups during strong trending periods.
Gradient Range [BigBeluga] provides an elegant and data-driven approach to range-bound market analysis. With its gradient visualization and smart reversion detection, it empowers traders to better time entries and exits within consolidation zones.
發行說明
Detailed technical version of the Gradient Range [BigBeluga] description:🔵Dynamic Range Box Construction:
The indicator uses the highest and lowest closing prices over a user-defined lookback period to draw a transparent rectangle that defines the active price range.
A dashed midline is drawn at the average between the high and low levels, helping traders spot directional bias within the range.
H = array.new<float>(box_len)
// Store historical prices in array on the last bar
if barstate.islast
for i = 0 to box_len
H.push(close)
// Calculate highest, lowest, and mid prices from the historical array
h = H.max()
l = H.min()
m = (h+l) /2
🔵Gradient-Based Candlestick Rendering:
Instead of relying on default candles, the indicator redraws every OHLC bar using line graphic objects, two lines per bar, body and wick.
if barstate.islast
src = 0.
for i = 0 to box_len-1
src := m - close
values.set(i, src)
if display_candlesticks
for i = 0 to box_len-1
color_ = color.from_gradient(values.get(i), values.min(), values.max(), col_top, col_bot)
// Draw Candlesticks
line.new(bar_index-i, high, bar_index-i, low, color = color_, width = 1, force_overlay = true)
line.new(bar_index-i, open, bar_index-i, close, color = color_, width = 5, force_overlay = true)
Each bar is assigned a color gradient depending on how far its close is from the midpoint of the range.
Candles near the upper bound are shaded with bearish tones (e.g. purple), while those near the lower bound are colored with bullish tones (e.g. lime).
This creates a clear visual heatmap of price distribution within the range.
🔵Trend State Detection via ADX:
The ADX indicator (with adjustable parameters) is used to classify the current market condition.
If ADX is below 35, the system considers the market to be ranging;
otherwise,
it is marked as trending
A small label appears in the bottom-right corner of the chart indicating the state:
🟢 Ranging or 🟡 Trending.
🔵 Mean Reversion Signal Circles:
When the market is identified as ranging, the indicator checks for local highs or lows (defined by a candle’s wick) that breach the upper or lower bounds of the price box.
If price steps outside the range and reverses back in, a white circular marker is plotted on the wick using polyline graphic objects.
draw_circle(bool src, int mult_x, int mult_y, offset) =>
points.clear()
float angle = 0
var float source = 0.
var color color = na
switch
src => source := high[offset+1]
=> source := low[offset+1]
for i = 1 to 11 by 1
int xValue = int(math.round(2 * mult_x * math.sin(angle))) + bar_index -1- offset
float yValue = atr * mult_y * math.cos(angle) + source
angle := angle + math.pi / 5
points.push(chart.point.from_index(xValue, yValue))
polyline.new(points, curved = false, line_color = col_mr, line_width = 1, force_overlay = false)
These markers act as visual cues for exhaustion points or potential reversion zones.
🔵Efficient Real-Time Rendering:
All calculations and visual elements are processed only on the last bar.
This includes the range box, the custom candles, gradient mapping, and signal markers — allowing the script to stay lightweight and responsive.
開源腳本
秉持TradingView一貫精神,這個腳本的創作者將其設為開源,以便交易者檢視並驗證其功能。向作者致敬!您可以免費使用此腳本,但請注意,重新發佈代碼需遵守我們的社群規範。
🔵Gain access to our powerful tools : bigbeluga.com/tv
🔵Join our free discord for updates : bigbeluga.com/discord
All scripts & content provided by BigBeluga are for informational & educational purposes only.
🔵Join our free discord for updates : bigbeluga.com/discord
All scripts & content provided by BigBeluga are for informational & educational purposes only.
免責聲明
這些資訊和出版物並非旨在提供,也不構成TradingView提供或認可的任何形式的財務、投資、交易或其他類型的建議或推薦。請閱讀使用條款以了解更多資訊。