INVITE-ONLY SCRIPT
已更新 Ghost Vision II
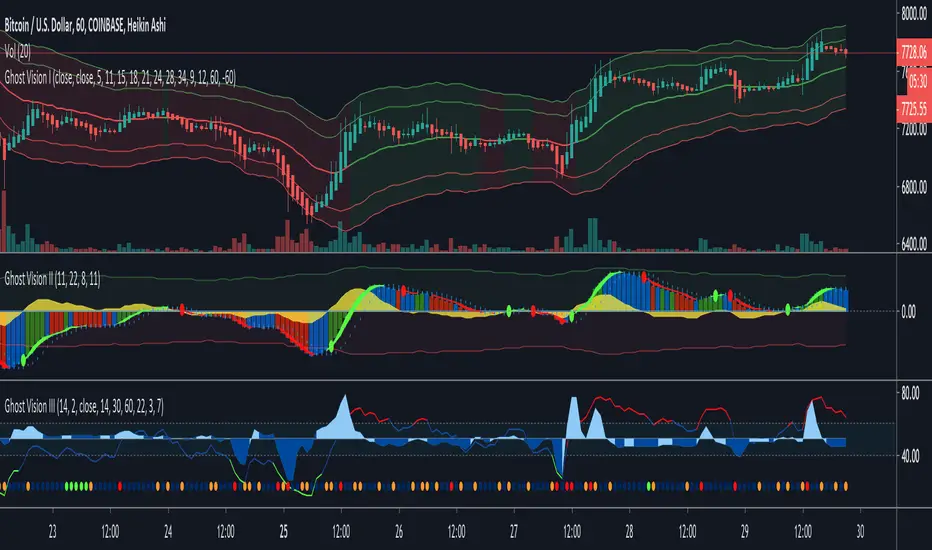
Price action zone — above(green) and below(red) the line is an indication of where the price action is currently at you can also identify the current direction and strength by using the mountains.
Column colors provide feedback with three colors blue, green and red. They have an important function in which they tell you what you shouldn’t be doing against momentum and strength.
GhostVision II — Will answer you for the following questions:
Should you be looking for long or short opportunities?
What is the direction of the current trend?
How strong is the direction of the current trend?
The current trend in a divergence?
Did the trend direction change or about to?
I’m allowed to go short or long now or wait?
發行說明
Update theme colors for better visibility僅限邀請腳本
僅作者批准的使用者才能訪問此腳本。您需要申請並獲得使用許可,通常需在付款後才能取得。更多詳情,請依照作者以下的指示操作,或直接聯絡GhostVision。
TradingView不建議在未完全信任作者並了解其運作方式的情況下購買或使用腳本。您也可以在我們的社群腳本中找到免費的開源替代方案。
作者的說明
免責聲明
這些資訊和出版物並非旨在提供,也不構成TradingView提供或認可的任何形式的財務、投資、交易或其他類型的建議或推薦。請閱讀使用條款以了解更多資訊。
僅限邀請腳本
僅作者批准的使用者才能訪問此腳本。您需要申請並獲得使用許可,通常需在付款後才能取得。更多詳情,請依照作者以下的指示操作,或直接聯絡GhostVision。
TradingView不建議在未完全信任作者並了解其運作方式的情況下購買或使用腳本。您也可以在我們的社群腳本中找到免費的開源替代方案。
作者的說明
免責聲明
這些資訊和出版物並非旨在提供,也不構成TradingView提供或認可的任何形式的財務、投資、交易或其他類型的建議或推薦。請閱讀使用條款以了解更多資訊。