OPEN-SOURCE SCRIPT
Iron Condor & Butterfly Visualizer
It helps you visualize and manage your option spread by:
Plotting strike prices and breakeven lines directly on the chart.
Showing profit/loss zones, adjustment zones, and alerts when price nears critical levels.
Calculating risk/reward, probability of profit, theta decay, IV condition, and trade score.
🎯 2. Inputs & Configuration
You input your trade details as a comma-separated string:
For an Iron Condor
ShortCall, LongCall, ShortPut, LongPut, Credit, Contracts, Target%
Example: 626,628,620,618,1.20,1,30
For a Butterfly Spread
LowerWing, Body, UpperWing, Debit, Contracts, Target%
Example: 600,620,640,2.50,2,50
The indicator automatically parses this and knows which strategy type you selected.
You can also control:
Visuals (profit zones, breakevens, labels)
Risk (stop loss %, adjustment zones)
Account/risk sizing
Market conditions (IV Rank, current IV, DTE)
⚙️ 3. Data Parsing & Strategy Recognition
The code reads your pasted string, splits it by commas, and determines:
Which strikes are short vs long (or wings/body for Butterfly)
Whether the strategy is credit (Iron Condor) or debit (Butterfly)
Calculates net credit/debit, contract size, and profit target
📈 4. Profit/Loss Calculations
It dynamically calculates:
Max Profit
Iron Condor: net credit × 100 × contracts
Butterfly: (wing width − debit) × 100 × contracts
Max Loss
Iron Condor: difference between strikes minus credit
Butterfly: debit × 100 × contracts
Breakeven points
Iron Condor: short strikes ± net credit
Butterfly: body ± debit
Current P&L relative to the live price (close).
⚖️ 5. Risk & Position Sizing
It checks:
Stop-loss trigger (% of max loss)
Adjustment alert if price nears short strikes
Recommended contract size based on account size and % risk per trade
Actual % of account at risk
⏱️ 6. Time Decay & IV Analysis
If you input days to expiration, it shows:
Theta (approx daily time decay)
Decay progress bar (% of 30-day cycle)
IV condition:
Green: favorable (>50 IV Rank)
Yellow: neutral (30–50)
Red: poor (<30)
🧮 7. Trade Scoring
It gives a Trade Score (0–100) based on:
IV Rank (favorable market)
Risk/Reward ratio
Probability of profit
Default 20 baseline points
This helps gauge whether the setup is statistically attractive.
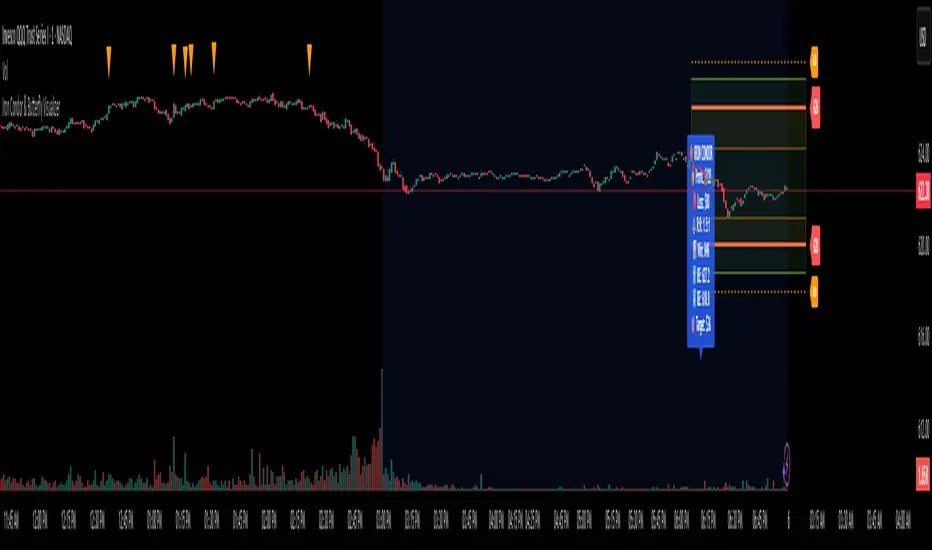
🧠 8. Visualizations
When the indicator runs, it draws on your chart:
Lines
Red = short strikes
Orange dashed = long strikes
Yellow dotted = breakeven levels
Boxes
Green = profit zone
Orange shaded = adjustment zones (approaching danger)
Labels (optional)
Strike labels (call/put prices)
Info box summarizing:
Profit, loss, risk/reward
Breakevens, theta, target, gamma risk flag
🚨 9. Alerts
The script triggers TradingView alerts when:
Price nears call or put adjustment zones
Profit target is hit
Stop loss is hit
These help you manage the trade without constant monitoring.
🧭 10. In Practice
You’d:
Copy the option strikes and trade details from your broker or analyzer.
Paste them into 📋 PASTE YOUR TRADE DATA HERE.
The indicator plots:
Profit/loss region
Adjustment warnings
Key metrics
Alerts if your trade is in danger or near target.
Plotting strike prices and breakeven lines directly on the chart.
Showing profit/loss zones, adjustment zones, and alerts when price nears critical levels.
Calculating risk/reward, probability of profit, theta decay, IV condition, and trade score.
🎯 2. Inputs & Configuration
You input your trade details as a comma-separated string:
For an Iron Condor
ShortCall, LongCall, ShortPut, LongPut, Credit, Contracts, Target%
Example: 626,628,620,618,1.20,1,30
For a Butterfly Spread
LowerWing, Body, UpperWing, Debit, Contracts, Target%
Example: 600,620,640,2.50,2,50
The indicator automatically parses this and knows which strategy type you selected.
You can also control:
Visuals (profit zones, breakevens, labels)
Risk (stop loss %, adjustment zones)
Account/risk sizing
Market conditions (IV Rank, current IV, DTE)
⚙️ 3. Data Parsing & Strategy Recognition
The code reads your pasted string, splits it by commas, and determines:
Which strikes are short vs long (or wings/body for Butterfly)
Whether the strategy is credit (Iron Condor) or debit (Butterfly)
Calculates net credit/debit, contract size, and profit target
📈 4. Profit/Loss Calculations
It dynamically calculates:
Max Profit
Iron Condor: net credit × 100 × contracts
Butterfly: (wing width − debit) × 100 × contracts
Max Loss
Iron Condor: difference between strikes minus credit
Butterfly: debit × 100 × contracts
Breakeven points
Iron Condor: short strikes ± net credit
Butterfly: body ± debit
Current P&L relative to the live price (close).
⚖️ 5. Risk & Position Sizing
It checks:
Stop-loss trigger (% of max loss)
Adjustment alert if price nears short strikes
Recommended contract size based on account size and % risk per trade
Actual % of account at risk
⏱️ 6. Time Decay & IV Analysis
If you input days to expiration, it shows:
Theta (approx daily time decay)
Decay progress bar (% of 30-day cycle)
IV condition:
Green: favorable (>50 IV Rank)
Yellow: neutral (30–50)
Red: poor (<30)
🧮 7. Trade Scoring
It gives a Trade Score (0–100) based on:
IV Rank (favorable market)
Risk/Reward ratio
Probability of profit
Default 20 baseline points
This helps gauge whether the setup is statistically attractive.
🧠 8. Visualizations
When the indicator runs, it draws on your chart:
Lines
Red = short strikes
Orange dashed = long strikes
Yellow dotted = breakeven levels
Boxes
Green = profit zone
Orange shaded = adjustment zones (approaching danger)
Labels (optional)
Strike labels (call/put prices)
Info box summarizing:
Profit, loss, risk/reward
Breakevens, theta, target, gamma risk flag
🚨 9. Alerts
The script triggers TradingView alerts when:
Price nears call or put adjustment zones
Profit target is hit
Stop loss is hit
These help you manage the trade without constant monitoring.
🧭 10. In Practice
You’d:
Copy the option strikes and trade details from your broker or analyzer.
Paste them into 📋 PASTE YOUR TRADE DATA HERE.
The indicator plots:
Profit/loss region
Adjustment warnings
Key metrics
Alerts if your trade is in danger or near target.
開源腳本
秉持TradingView一貫精神,這個腳本的創作者將其設為開源,以便交易者檢視並驗證其功能。向作者致敬!您可以免費使用此腳本,但請注意,重新發佈代碼需遵守我們的社群規範。
免責聲明
這些資訊和出版物並非旨在提供,也不構成TradingView提供或認可的任何形式的財務、投資、交易或其他類型的建議或推薦。請閱讀使用條款以了解更多資訊。
開源腳本
秉持TradingView一貫精神,這個腳本的創作者將其設為開源,以便交易者檢視並驗證其功能。向作者致敬!您可以免費使用此腳本,但請注意,重新發佈代碼需遵守我們的社群規範。
免責聲明
這些資訊和出版物並非旨在提供,也不構成TradingView提供或認可的任何形式的財務、投資、交易或其他類型的建議或推薦。請閱讀使用條款以了解更多資訊。