OPEN-SOURCE SCRIPT
volatility-weighted price change divergence
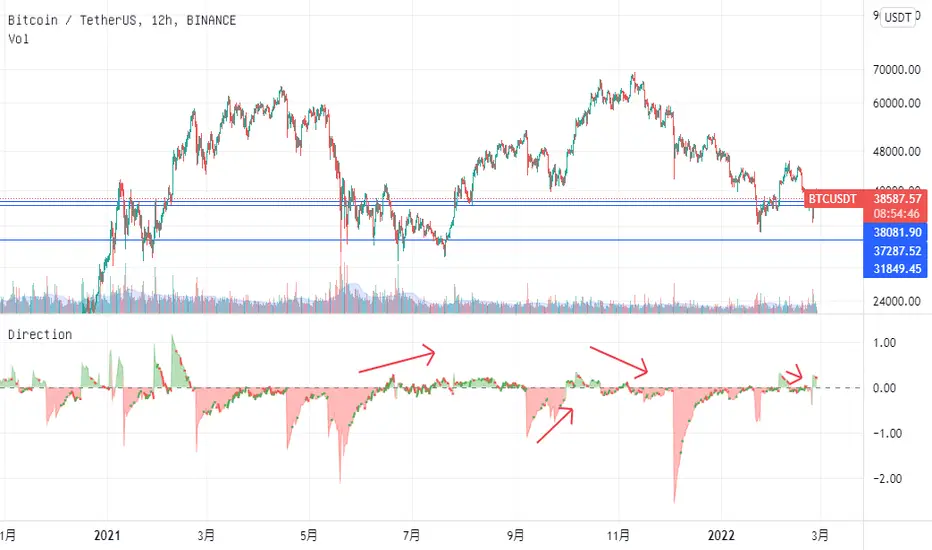
EMA of intrabar-volatility-weighted price change minus EMA of price change. It puts more weights on candles that have large volatility inside, and assumes that the direction of those high-volatility candles are more meaningful than low-volatility ones. Therefore, we take the difference between the volatility-weighted price change and the regular price change and plot the EMA. The indicator may be used as a tool to find divergence and potential reversal, or hints of continuation of a strong trend. Note that this indicator can change a lot with different time frames and settings, so take care to backtest before using. Recommended settings are 15m resolution for time frames longer than 4H and 1m resolution (with 200 EMA length) for time frames below 4H. The resolution is used to find the intrabar volatility.
開源腳本
秉持TradingView一貫精神,這個腳本的創作者將其設為開源,以便交易者檢視並驗證其功能。向作者致敬!您可以免費使用此腳本,但請注意,重新發佈代碼需遵守我們的社群規範。
免責聲明
這些資訊和出版物並非旨在提供,也不構成TradingView提供或認可的任何形式的財務、投資、交易或其他類型的建議或推薦。請閱讀使用條款以了解更多資訊。
開源腳本
秉持TradingView一貫精神,這個腳本的創作者將其設為開源,以便交易者檢視並驗證其功能。向作者致敬!您可以免費使用此腳本,但請注意,重新發佈代碼需遵守我們的社群規範。
免責聲明
這些資訊和出版物並非旨在提供,也不構成TradingView提供或認可的任何形式的財務、投資、交易或其他類型的建議或推薦。請閱讀使用條款以了解更多資訊。