OPEN-SOURCE SCRIPT
已更新 (RSI + CCI) × (MACD/ATR)^2
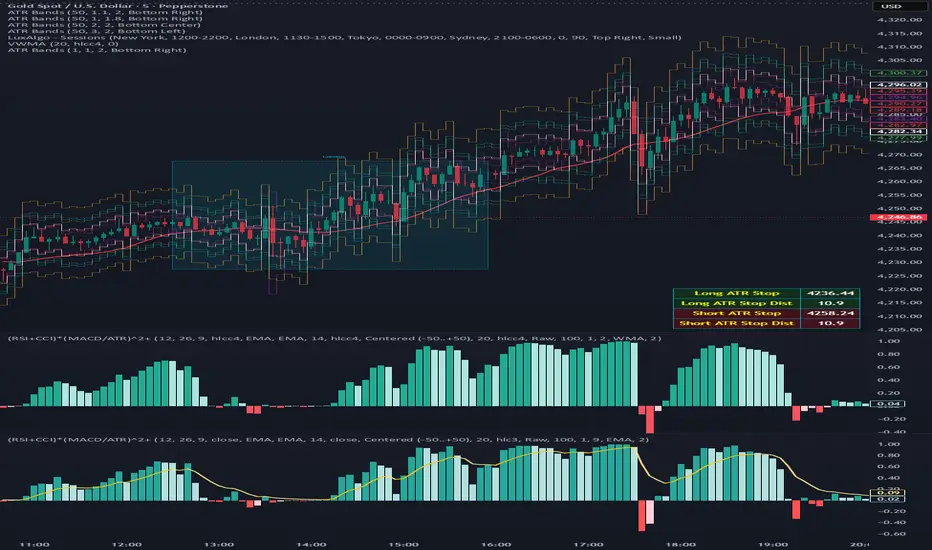
⚙️ (RSI + CCI) × (MACD / ATR)² Composite — Normalized, Compressed, Dynamic Colors
This advanced composite oscillator merges three powerful momentum indicators — RSI, CCI, and MACD — into one normalized and volatility-adjusted signal that reacts smoothly across all markets.
By dividing MACD by ATR (Average True Range), the indicator self-scales for different symbols, and an optional tanh-like compression prevents extreme spikes while keeping the movement fluid and responsive.
🧩 Core Formula
(RSI + CCI) × (MACD / ATR)²
(optionally passed through a tanh compression for stability)
RSI and CCI are normalized (RSI ÷ 50, CCI ÷ 100) → roughly −2 to +2 range.
MACD is volatility-adjusted by ATR → scale-independent between assets.
The result is centered around 0 for clear bullish/bearish momentum comparison.
🎨 Visual Features
🟢🔴 Dynamic 4-Color Histogram
Positive + Rising = Strong Teal
Positive + Falling = Light Teal
Negative + Falling = Strong Red
Negative + Rising = Light Red
🟡⚫ 4-Color Smoothing Line
Positive & Rising = Bright Yellow
Positive & Falling = Soft Yellow
Negative & Rising = Grey
Negative & Falling = Dark Grey
Zero-centered layout for intuitive bullish/bearish visualization.
⚙️ Adjustable Parameters
Individual RSI, CCI, and MACD lengths and sources.
ATR length for volatility normalization.
Optional tanh-style compression with adjustable gain (to keep values in ±1 range).
Fully customizable colors and line widths for both bars and smoothing line.
🔔 Alerts
Triggered automatically when the composite crosses above or below zero, signaling potential trend reversals or momentum shifts.
💡 How to Use
Composite > 0 → Bullish momentum ↑
Composite < 0 → Bearish momentum ↓
A brightening line or bar = momentum accelerating.
A fading color = momentum weakening or reversal forming.
Combine with higher-timeframe trend filters (EMA, VWAP, Supertrend) for confirmation.
發行說明
OverviewThis indicator fuses RSI, CCI, and a volatility-normalized MACD into one smooth, scale-independent oscillator.
By dividing MACD by ATR, the output becomes volatility-adjusted and self-scaling across all markets, making it easier to compare momentum strength between instruments.
Key Features
Dynamic 4-color histogram showing positive/negative + rising/falling momentum
4-color smoothed signal line for clarity of trend strength
Adjustable RSI, CCI, MACD, and ATR lengths
Optional tanh-style compression and smoothing type selector (EMA, SMA, WMA, etc.)
Centered zero-line view for clear bullish/bearish shifts
Alerts when the composite crosses above/below zero
How to Use
Above zero → bullish momentum
Below zero → bearish momentum
Brightening color → acceleration
Fading color → slowdown or reversal
Attribution
The idea of volatility normalization (MACD ÷ ATR) is conceptually inspired by “MACD-v: Volatility Normalised Momentum” by Alex Spiroglou (2015 idea, publicly presented 2022).
His pioneering research received the NAAIM Founders Award and the CMT Association Charles H. Dow Award in 2022.
No code from the MACD-v paper is used — this script is an independent implementation acknowledging his foundational concept.
Created by: [Hay_C]
Independent development and design © 2025
開源腳本
秉持TradingView一貫精神,這個腳本的創作者將其設為開源,以便交易者檢視並驗證其功能。向作者致敬!您可以免費使用此腳本,但請注意,重新發佈代碼需遵守我們的社群規範。
HK-Uk Hoiliday Trader, Short-term programme trade, Forex-Commodities-Crypto, 2005-2023
免責聲明
這些資訊和出版物並非旨在提供,也不構成TradingView提供或認可的任何形式的財務、投資、交易或其他類型的建議或推薦。請閱讀使用條款以了解更多資訊。
開源腳本
秉持TradingView一貫精神,這個腳本的創作者將其設為開源,以便交易者檢視並驗證其功能。向作者致敬!您可以免費使用此腳本,但請注意,重新發佈代碼需遵守我們的社群規範。
HK-Uk Hoiliday Trader, Short-term programme trade, Forex-Commodities-Crypto, 2005-2023
免責聲明
這些資訊和出版物並非旨在提供,也不構成TradingView提供或認可的任何形式的財務、投資、交易或其他類型的建議或推薦。請閱讀使用條款以了解更多資訊。