OPEN-SOURCE SCRIPT
Bollinger Bands %B + ATR
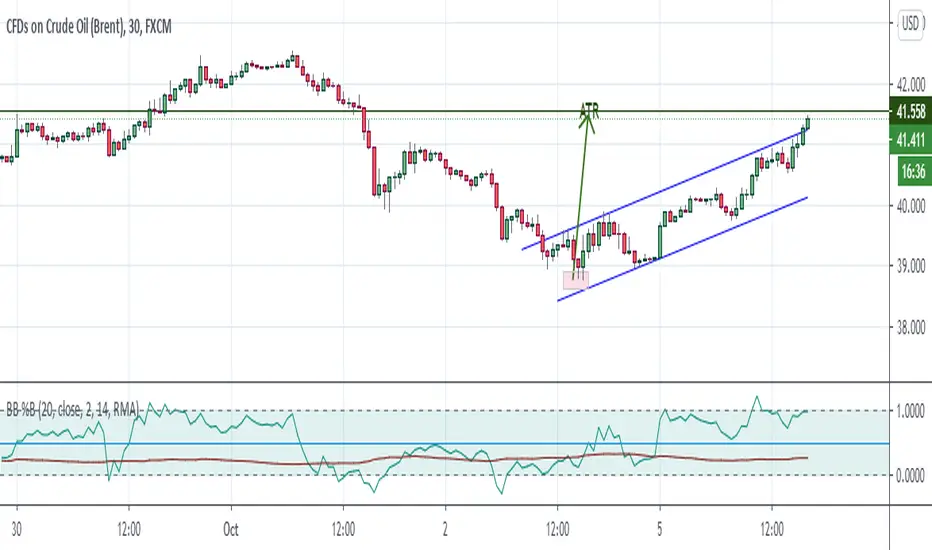
This indicator is best suitable for the 30-minutes interval OIL charts, due to ATR accuracy.
BB%B is great for showing oversold/overbought market conditions and offers excellent entry/exit opportunities for Day Trading (30 minutes chart), as well as reliable convergence/divergence patterns. ATR is conveniently combined and shows potential market volatility levels for the day when used in 30-minutes charts, thus demarcating your day trade exit point.
To use the ATR on this indicator: Just read the ATR value of the lowest (for a new bull trend) or the highest (for a new bear trend) candlestick of the newly formed trend leg. Let's suppose the ATR reads 0.2891, then you project a move of 2.891 points towards the given trend direction using the ruler tool (30-minutes charts). That's all, and there you have your take profit target!
Good Luck!!!
開源腳本
秉持TradingView一貫精神,這個腳本的創作者將其設為開源,以便交易者檢視並驗證其功能。向作者致敬!您可以免費使用此腳本,但請注意,重新發佈代碼需遵守我們的社群規範。
免責聲明
這些資訊和出版物並非旨在提供,也不構成TradingView提供或認可的任何形式的財務、投資、交易或其他類型的建議或推薦。請閱讀使用條款以了解更多資訊。
免責聲明
這些資訊和出版物並非旨在提供,也不構成TradingView提供或認可的任何形式的財務、投資、交易或其他類型的建議或推薦。請閱讀使用條款以了解更多資訊。