OPEN-SOURCE SCRIPT
Vertical and Horizontal Lines on given Dates

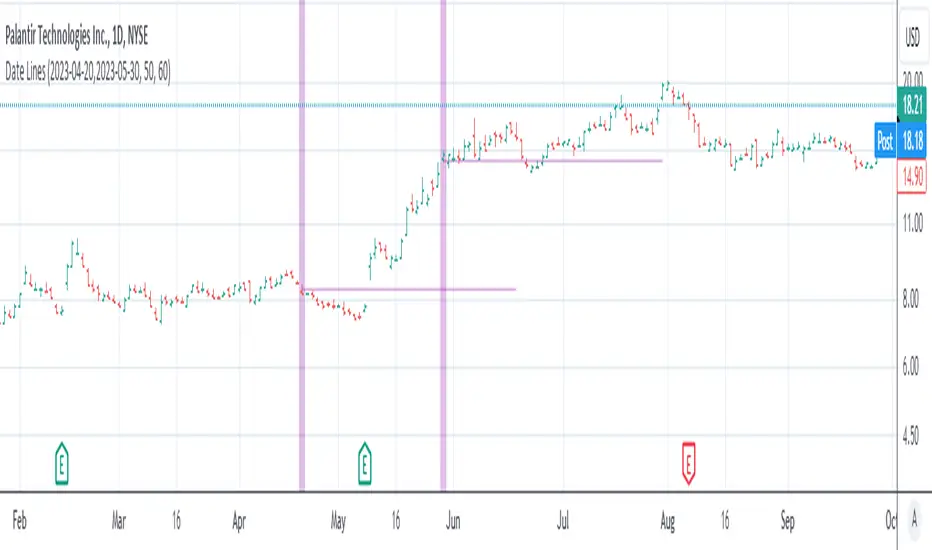
This simple indicator is to show the impact of given dates on the chart:
The dates need to be entered in a yyyy-MM-dd format, separated by comma (,) or space+comma ( ,).
The event can be shown on the chart with a vertical highlighting.
The midpoint of the price action that day can be shown as a vertical line.
Hint: If you load a lot of dates into it, best disable the "Indicator Arguments" in "Chart Settings" -> "Status line" to not have the chart littered with these date arguments.
開源腳本
秉持TradingView一貫精神,這個腳本的創作者將其設為開源,以便交易者檢視並驗證其功能。向作者致敬!您可以免費使用此腳本,但請注意,重新發佈代碼需遵守我們的社群規範。
免責聲明
這些資訊和出版物並非旨在提供,也不構成TradingView提供或認可的任何形式的財務、投資、交易或其他類型的建議或推薦。請閱讀使用條款以了解更多資訊。
開源腳本
秉持TradingView一貫精神,這個腳本的創作者將其設為開源,以便交易者檢視並驗證其功能。向作者致敬!您可以免費使用此腳本,但請注意,重新發佈代碼需遵守我們的社群規範。
免責聲明
這些資訊和出版物並非旨在提供,也不構成TradingView提供或認可的任何形式的財務、投資、交易或其他類型的建議或推薦。請閱讀使用條款以了解更多資訊。