OPEN-SOURCE SCRIPT
已更新 Burner Volume Candles
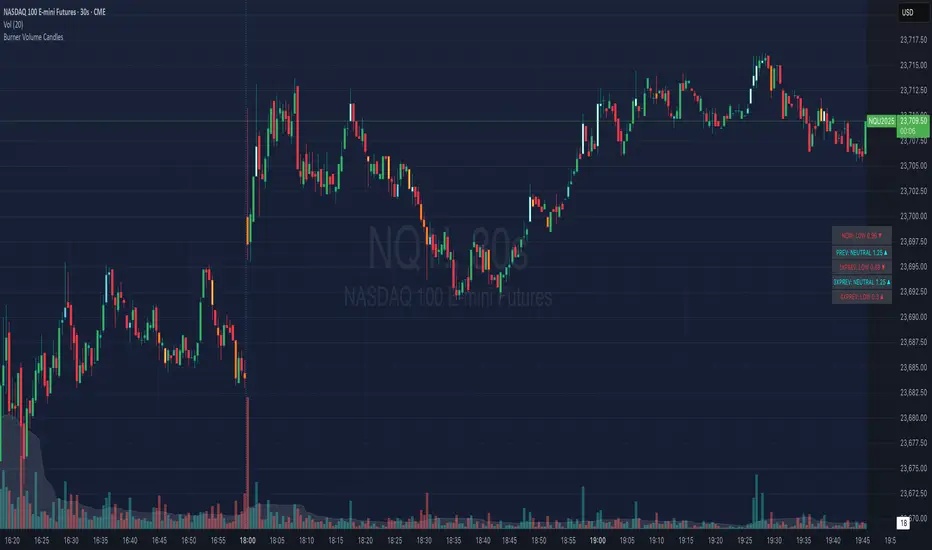
Visually see different candle colors based on volume relative to the look back period (default is last 20 candles).
This allows you to see if a current candle print is standard, high, or extreme sell/buy volume relative to the look back period.
This has been primarily used on the 30s timeframe on NQ.
It is also advised to take the NY open candle volume with a grain of salt as that is typically the extreme volume so it doesn't make this indicator as useful when it comes to those candles.
發行說明
Visually see different candle colors based on volume relative to the look back period (default is last 20 candles).This allows you to see if a current candle print is standard, high, or extreme sell/buy volume relative to the look back period.
This has been primarily used on the 30s timeframe on NQ.
It is also advised to take the NY open candle volume with a grain of salt as that is typically the extreme volume so it doesn't make this indicator as useful when it comes to those candles.
開源腳本
秉持TradingView一貫精神,這個腳本的創作者將其設為開源,以便交易者檢視並驗證其功能。向作者致敬!您可以免費使用此腳本,但請注意,重新發佈代碼需遵守我們的社群規範。
免責聲明
這些資訊和出版物並非旨在提供,也不構成TradingView提供或認可的任何形式的財務、投資、交易或其他類型的建議或推薦。請閱讀使用條款以了解更多資訊。
開源腳本
秉持TradingView一貫精神,這個腳本的創作者將其設為開源,以便交易者檢視並驗證其功能。向作者致敬!您可以免費使用此腳本,但請注意,重新發佈代碼需遵守我們的社群規範。
免責聲明
這些資訊和出版物並非旨在提供,也不構成TradingView提供或認可的任何形式的財務、投資、交易或其他類型的建議或推薦。請閱讀使用條款以了解更多資訊。