OPEN-SOURCE SCRIPT
已更新 Interquartile range
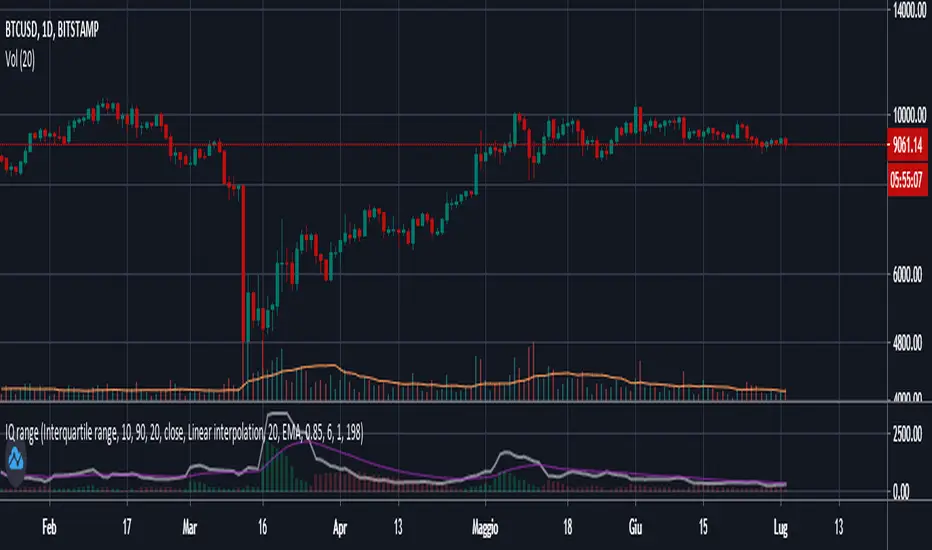
This script plots the Interquartile range (difference between 3rd and 1st quartile), providing useful infos about price distribution and volatility . It is designed to work paired with my other script "Moving percentiles channel", but you can also use it alone.
Features:
- You can compute the percentiles using Linear interpolation or Nearest Rank methods
- You can plot not only the Interquartile range, but also the range (difference between 100th and 0 percentiles) or a User defined range (you have to select which percentiles you want to use from the settings)
- The script also plots a signal line that you can use to obtain signals when the Range line crosses the signal line itself. You can plot the signal line using many different MAs ( SMA , EMA , DEMA , TEMA , WMA , VWMA , HMA , ALMA , LSMA , FRAMA ).
- It also plots an histogram that represents the difference between the Range and the Signal line. It will be green colored when positive, and red colored when negative.
Please show me your support and follow me if you like my scripts. Many more of them are coming in the future.
@ Bezzus
發行說明
Updates:- Removed unnecessary code lines.
Bezzus
開源腳本
秉持TradingView一貫精神,這個腳本的創作者將其設為開源,以便交易者檢視並驗證其功能。向作者致敬!您可以免費使用此腳本,但請注意,重新發佈代碼需遵守我們的社群規範。
免責聲明
這些資訊和出版物並非旨在提供,也不構成TradingView提供或認可的任何形式的財務、投資、交易或其他類型的建議或推薦。請閱讀使用條款以了解更多資訊。
免責聲明
這些資訊和出版物並非旨在提供,也不構成TradingView提供或認可的任何形式的財務、投資、交易或其他類型的建議或推薦。請閱讀使用條款以了解更多資訊。