PROTECTED SOURCE SCRIPT
VIXRatio Histogram
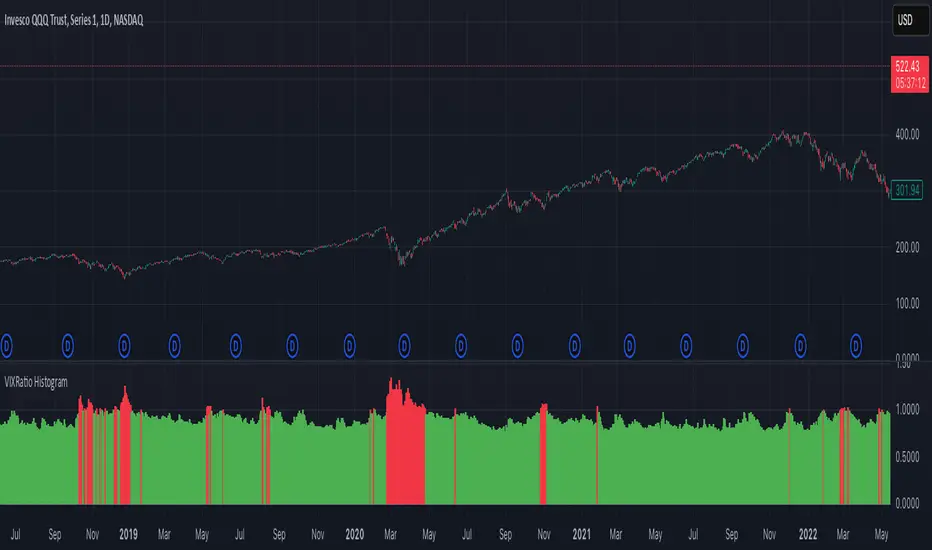
VIX3M-VIX Difference Histogram Indicator
Overview
This indicator measures the difference between the 3-month VIX (VIX3M) and the standard 30-day VIX, displayed as a color-coded histogram. When the histogram is green, VIX3M exceeds VIX, indicating a normal term structure. When red, the term structure is inverted.
Market Timing Benefits
The VIX3M-VIX spread serves as a powerful market timing tool for daily chart analysis:
- Green Histogram (Positive Spread): Represents a normal volatility term structure where longer-dated volatility (VIX3M) is priced higher than short-term volatility (VIX). This typically occurs during relatively stable market conditions and signals potentially favorable environments for risk assets.
- Red Histogram (Negative Spread): Indicates volatility term structure inversion, where short-term volatility expectations exceed longer-term expectations. This pattern often emerges during market stress and can signal heightened risk aversion.
- Transition Points: The crossing of the histogram from positive to negative (or vice versa) frequently precedes significant market turning points, offering early warning signals for potential trend changes.
- Magnitude Awareness: The size of the histogram bars indicates the intensity of the relationship – larger green bars suggest strong market confidence, while deeper red bars may signal severe market distress.
Recommended Usage
For optimal results, use this indicator on the daily timeframe alongside trend analysis and other market breadth indicators. The VIXRatio relationship has historically provided valuable context for market conditions, helping traders adjust positioning before major market shifts materialize in price action.
To fully understand its power, please refer to this article on Substack
受保護腳本
此腳本以閉源形式發佈。 不過,您可以自由使用,沒有任何限制 — 點擊此處了解更多。
免責聲明
這些資訊和出版物並非旨在提供,也不構成TradingView提供或認可的任何形式的財務、投資、交易或其他類型的建議或推薦。請閱讀使用條款以了解更多資訊。
受保護腳本
此腳本以閉源形式發佈。 不過,您可以自由使用,沒有任何限制 — 點擊此處了解更多。
免責聲明
這些資訊和出版物並非旨在提供,也不構成TradingView提供或認可的任何形式的財務、投資、交易或其他類型的建議或推薦。請閱讀使用條款以了解更多資訊。