OPEN-SOURCE SCRIPT
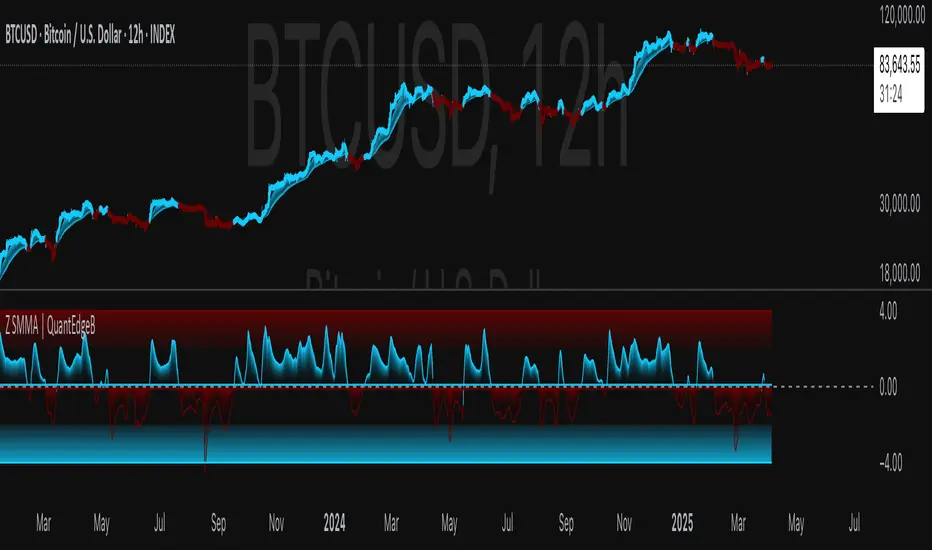
Z SMMA | QuantEdgeB
📈 Introducing Z-Score SMMA (Z SMMA) by QuantEdgeB
🛠️ Overview
Z SMMA is a momentum-driven oscillator designed to track the standardized deviation of a Smoothed Moving Average (SMMA). By applying Z-score normalization, this tool dynamically adapts to price volatility, enabling traders to detect meaningful directional shifts and trend changes with enhanced clarity.
It serves both as a trend-following and mean-reversion system, identifying opportunities through standardized thresholds while remaining robust across volatile and calm market conditions.
✨ Key Features
🔹 Z-Score Normalization Engine
Applies Z-score to a custom SMMA baseline, allowing traders to compare price action relative to its recent volatility-adjusted mean.
🔹 Dynamic Trend Detection
Generates actionable long/short signals based on customizable Z-thresholds, making it adaptable across different asset classes and timeframes.
🔹 Overbought/Oversold Zones
Highlight reversion and profit-taking zones (default OB: +2 to +4, OS: -2 to -4), great for counter-trend or mean-reversion strategies.
🔹 Visual Reinforcement Tools
Includes candle coloring, gradient fills, and optional ALMA/EMA band overlays to visualize trend regime transitions.
🔍 How It Works
1️⃣ Z-Score SMMA Calculation
The core is a custom Smoothed Moving Average (SMMA) that is normalized by its standard deviation over a lookback period.
Final Formula:
Z = (SMMA - Mean) / StdDev
2️⃣ Signal Generation
• ✅ Long Bias: Z-Score > Long Threshold (default: 0)
• ❌ Short Bias: Z-Score < Short Threshold (default: 0)
3️⃣ Visual Aids
• Candle Color → Shows trend bias
• Band Fills → Highlight trend strength
• Overlays → Optional ALMA/EMA bands for structure analysis
⚙️ Custom Settings
• SMMA Length → Default: 12
• Z-Score Lookback → Default: 30
• Long Threshold → Default: 0
• Short Threshold → Default: 0
• Color Themes → Choose from 6 visual modes
• Extra Plots → Toggle advanced overlays (ALMA, EMA, bands)
• Label Display → Show/hide “𝓛𝓸𝓷𝓰” & “𝓢𝓱𝓸𝓻𝓽” markers
👥 Who Should Use It?
✅ Trend Traders → For early entries with confirmation from Z-score expansion
✅ Quantitative Analysts → Standardized deviation enables comparison across assets
✅ Mean-Reversion Traders → Use OB/OS zones to fade parabolic spikes
✅ Swing & Systematic Traders → Identify momentum shifts with optional ALMA/EMA overlays
📌 Conclusion
Z SMMA offers a smart, adaptive framework for tracking deviation from equilibrium in a quant-friendly format. Whether you're looking to follow trends or catch exhaustion points, Z SMMA provides a clear, standardized view of momentum and price extremes.
🔹 Key Takeaways:
1️⃣ Z-Score standardization ensures dynamic range awareness
2️⃣ SMMA base filters out noise, offering smoother signals
3️⃣ Color-coded visuals support faster reaction and cleaner charts
📌 Disclaimer: Past performance is not indicative of future results. No trading strategy can guarantee success in financial markets.
📌 Strategic Advice: Always backtest, optimize, and align parameters with your trading objectives and risk tolerance before
開源腳本
秉持TradingView一貫精神,這個腳本的創作者將其設為開源,以便交易者檢視並驗證其功能。向作者致敬!您可以免費使用此腳本,但請注意,重新發佈代碼需遵守我們的社群規範。
🔹 Get access to our premium tools:
whop.com/quantedgeb/ 💎
🔹 Unlock our free toolbox:
tradinglibrary.carrd.co/ 🛠️
Disclaimer: All resources and indicators provided are for educational purposes only
whop.com/quantedgeb/ 💎
🔹 Unlock our free toolbox:
tradinglibrary.carrd.co/ 🛠️
Disclaimer: All resources and indicators provided are for educational purposes only
免責聲明
這些資訊和出版物並非旨在提供,也不構成TradingView提供或認可的任何形式的財務、投資、交易或其他類型的建議或推薦。請閱讀使用條款以了解更多資訊。