OPEN-SOURCE SCRIPT
已更新 Overnight vs Intra-day Performance

█ STRATEGY OVERVIEW
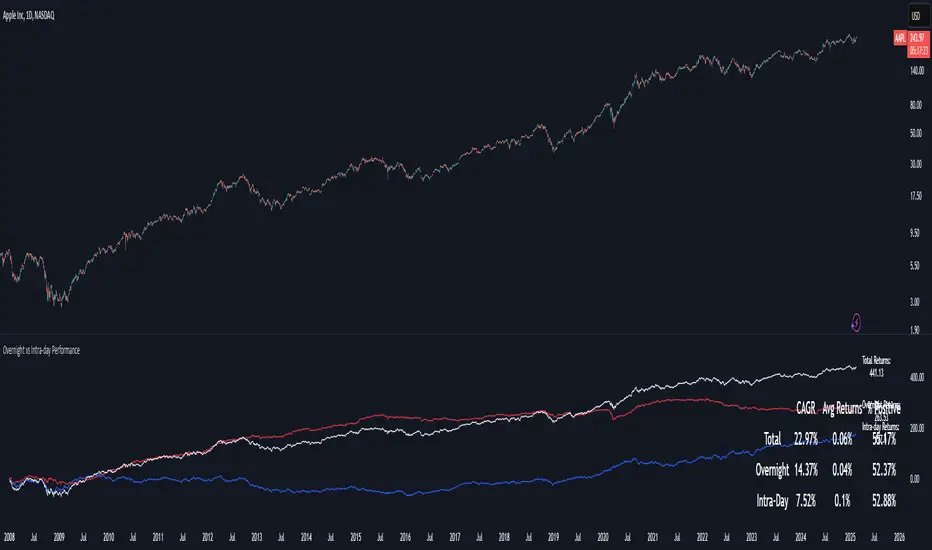
The "Overnight vs Intra-day Performance" indicator quantifies price behaviour differences between trading hours and overnight periods. It calculates cumulative returns, compound growth rates, and visualizes performance components across user-defined time windows. Designed for analytical use, it helps identify whether returns are primarily generated during market hours or overnight sessions.
█ USAGE
Use this indicator on Stocks and ETFs to visualise and compare intra-day vs overnight performance
█ KEY FEATURES
█ VISUALIZATION SYSTEM
1. Time-Series
2. Summary Table
3. Price Chart Labels
█ PURPOSE
█ IDEAL USERS
1. Portfolio Managers
2. Quantitative Researchers
3. Market Microstructure Analysts
4. Day Traders
The "Overnight vs Intra-day Performance" indicator quantifies price behaviour differences between trading hours and overnight periods. It calculates cumulative returns, compound growth rates, and visualizes performance components across user-defined time windows. Designed for analytical use, it helps identify whether returns are primarily generated during market hours or overnight sessions.
█ USAGE
Use this indicator on Stocks and ETFs to visualise and compare intra-day vs overnight performance
█ KEY FEATURES
- Return Segmentation: Separates total returns into overnight (close-to-open) and intraday (open-to-close) components
Growth Tracking: Shows simple cumulative returns and compound annual growth rates (CAGR)
█ VISUALIZATION SYSTEM
1. Time-Series
- Overnight Returns (Red)
- Intraday Returns (Blue)
- Total Returns (White)
2. Summary Table
- Displays CAGR
3. Price Chart Labels
- Floating annotations showing absolute returns and CAGR
- Color-coded to match plot series
█ PURPOSE
- Quantify market behaviour disparities between active trading sessions and overnight positioning
- Provide institutional-grade attribution analysis for returns generation
- Enable tactical adjustment of trading schedules based on historical performance patterns
- Serve as foundational research for session-specific trading strategies
█ IDEAL USERS
1. Portfolio Managers
- Analyse overnight risk exposure across holdings
- Optimize execution timing based on return distributions
2. Quantitative Researchers
- Study market microstructure through time-segmented returns
- Develop alpha models leveraging session-specific anomalies
3. Market Microstructure Analysts
- Identify liquidity patterns in overnight vs daytime sessions
- Research ETF premium/discount mechanics
4. Day Traders
- Align trading hours with highest probability return windows
- Avoid overnight gaps through informed position sizing
發行說明
Added average returns and percent positive開源腳本
秉持TradingView一貫精神,這個腳本的創作者將其設為開源,以便交易者檢視並驗證其功能。向作者致敬!您可以免費使用此腳本,但請注意,重新發佈代碼需遵守我們的社群規範。
免責聲明
這些資訊和出版物並非旨在提供,也不構成TradingView提供或認可的任何形式的財務、投資、交易或其他類型的建議或推薦。請閱讀使用條款以了解更多資訊。
開源腳本
秉持TradingView一貫精神,這個腳本的創作者將其設為開源,以便交易者檢視並驗證其功能。向作者致敬!您可以免費使用此腳本,但請注意,重新發佈代碼需遵守我們的社群規範。
免責聲明
這些資訊和出版物並非旨在提供,也不構成TradingView提供或認可的任何形式的財務、投資、交易或其他類型的建議或推薦。請閱讀使用條款以了解更多資訊。