OPEN-SOURCE SCRIPT
Weekly Manipulation
Understanding the "Weekly Manipulation" Indicator
The "Weekly Manipulation" indicator is a powerful tool designed to identify false breakouts in the market—moments. Let me explain how it works in simple terms.
What This Indicator Detects
This indicator spots two specific market behaviors that often indicate manipulation:
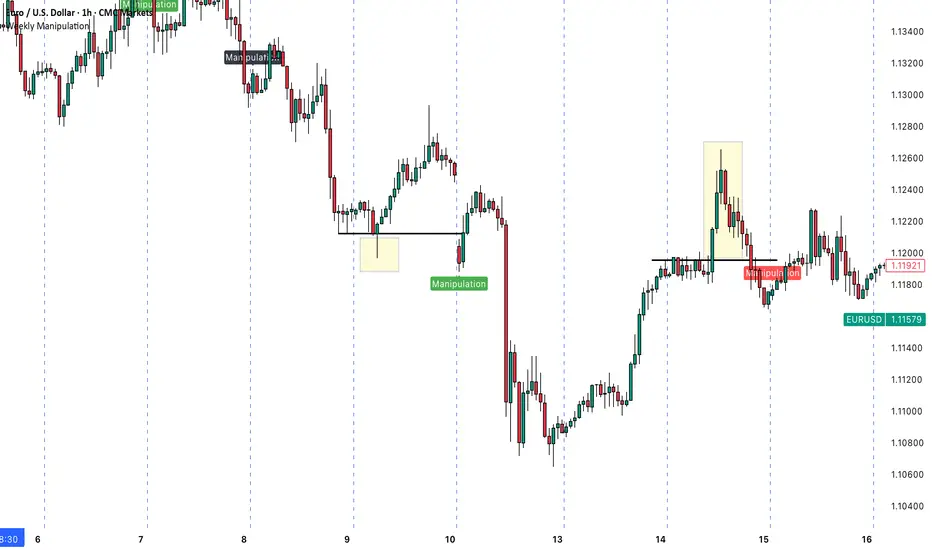
1. Single-Day Manipulation (Red/Green Labels)
This occurs when price briefly breaks through a significant daily level but fails to maintain the momentum:
Bearish Manipulation (Red): Price pushes above the previous day's high, but then reverses and closes below that high.
Bullish Manipulation (Green): Price drops below the previous day's low), but then reverses and closes above that low.
2. Two-Day Manipulation (Black Labels)
This is a more complex version of the same pattern, but occurring over a 2-day period. These signals can indicate even stronger manipulation attempts and potentially more powerful reversals.
Why This Matters for Your Trading
By identifying these patterns, you can:
- Avoid getting caught in false breakouts
- Find potential entry points after the manipulation is complete
- Understand when market action might not be genuine price discovery
How to Use This Indicator
1. Look for Red Markers: These appear when price has attempted to break higher but failed. This often suggests bearish potential going forward.
2. Look for Green Markers: These appear when price has attempted to break lower but failed. This often suggests bullish potential going forward.
3. Pay Attention to Black Markers: These 2-day patterns can signal stronger reversals and might be worth giving extra weight in your analysis.
The indicator labels these patterns clearly as "Manipulation" right on your chart, giving you an immediate visual cue when these potential setups occur.
The "Weekly Manipulation" indicator is a powerful tool designed to identify false breakouts in the market—moments. Let me explain how it works in simple terms.
What This Indicator Detects
This indicator spots two specific market behaviors that often indicate manipulation:
1. Single-Day Manipulation (Red/Green Labels)
This occurs when price briefly breaks through a significant daily level but fails to maintain the momentum:
Bearish Manipulation (Red): Price pushes above the previous day's high, but then reverses and closes below that high.
Bullish Manipulation (Green): Price drops below the previous day's low), but then reverses and closes above that low.
2. Two-Day Manipulation (Black Labels)
This is a more complex version of the same pattern, but occurring over a 2-day period. These signals can indicate even stronger manipulation attempts and potentially more powerful reversals.
Why This Matters for Your Trading
By identifying these patterns, you can:
- Avoid getting caught in false breakouts
- Find potential entry points after the manipulation is complete
- Understand when market action might not be genuine price discovery
How to Use This Indicator
1. Look for Red Markers: These appear when price has attempted to break higher but failed. This often suggests bearish potential going forward.
2. Look for Green Markers: These appear when price has attempted to break lower but failed. This often suggests bullish potential going forward.
3. Pay Attention to Black Markers: These 2-day patterns can signal stronger reversals and might be worth giving extra weight in your analysis.
The indicator labels these patterns clearly as "Manipulation" right on your chart, giving you an immediate visual cue when these potential setups occur.
開源腳本
秉持TradingView一貫精神,這個腳本的創作者將其設為開源,以便交易者檢視並驗證其功能。向作者致敬!您可以免費使用此腳本,但請注意,重新發佈代碼需遵守我們的社群規範。
免責聲明
這些資訊和出版物並非旨在提供,也不構成TradingView提供或認可的任何形式的財務、投資、交易或其他類型的建議或推薦。請閱讀使用條款以了解更多資訊。
開源腳本
秉持TradingView一貫精神,這個腳本的創作者將其設為開源,以便交易者檢視並驗證其功能。向作者致敬!您可以免費使用此腳本,但請注意,重新發佈代碼需遵守我們的社群規範。
免責聲明
這些資訊和出版物並非旨在提供,也不構成TradingView提供或認可的任何形式的財務、投資、交易或其他類型的建議或推薦。請閱讀使用條款以了解更多資訊。