INVITE-ONLY SCRIPT
已更新 [Top] LHAMA Supertrend
LHAMA Supertrend - Advanced Adaptive Trend Following System
Overview
The LHAMA Supertrend is an innovative trend-following indicator that combines adaptive moving average technology with intelligent signal confirmation. Unlike traditional supertrend indicators that rely on simple moving averages, this system uses my Low-High Adaptive Moving Average (🦙 LHAMA) algorithm that dynamically adjusts to market volatility and price action patterns. It is much more responsive to sudden price changes than traditional supertrend indicators, allowing you to jump in earlier and catch more of the move, and it manages this responsiveness without significantly increasing the number of false signals.
What Makes This Original
This indicator introduces several unique concepts not found in standard trend-following tools:
LHAMA Algorithm: The core innovation is the Low-High Adaptive Moving Average, which adapts its responsiveness based on the frequency of new highs and lows within a lookback period. This creates a more intelligent baseline that responds appropriately to different market conditions.
Delayed Confirmation System: Rather than generating immediate signals on price crossovers, the indicator implements a sophisticated confirmation mechanism using slope analysis. Signals are only triggered when both trend direction and momentum align, significantly reducing false signals.
Volume Integration: Optional volume weighting enhances the adaptive calculation, giving more weight to price movements during high-volume periods.
Daily Reset Functionality: Unique daily reset feature helps realign the indicator after overnight gaps, particularly useful for equity markets.
How It Works
LHAMA Calculation
The LHAMA baseline adapts using a coefficient derived from:
The calculation:
Pine Script®
Where the momentum adaptation increases when markets are making new highs or lows, allowing faster response during trending conditions while providing stability during consolidation.
Signal Generation
The indicator uses a two-stage signal process:
Visual Components
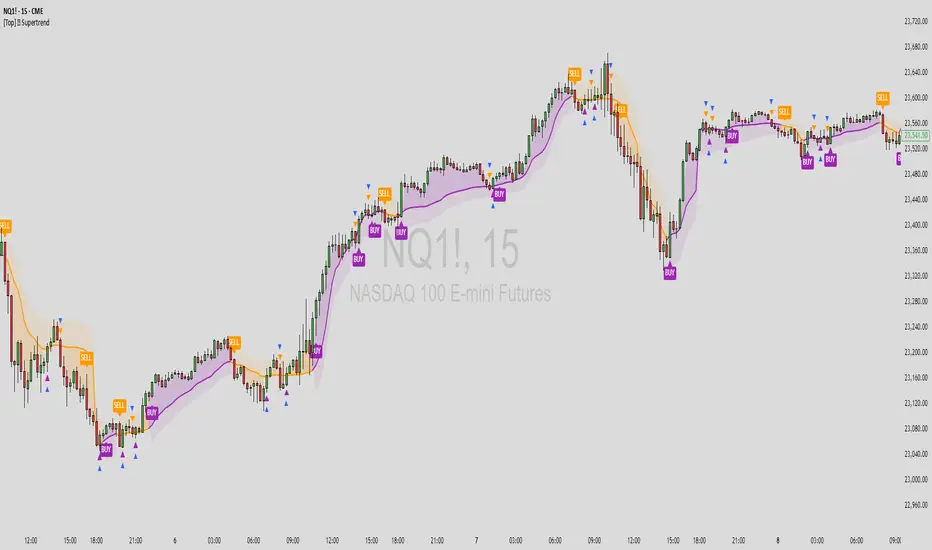
LHAMA Line: The adaptive baseline with optional angle-based gradient coloring that visualizes momentum strength
Trend Clouds: Dynamic fill areas that adapt to the last confirmed signal direction
ATR Halo: Opposite-side ATR band providing optional additional context for stop-loss placement
Confirmation Signals: Clear BUY/SELL labels only appear after full confirmation
How to Use
Basic Setup
Signal Interpretation
Advanced Features
Risk Management
The indicator provides multiple levels for stop-loss placement:
Best Practices
Timeframe Selection: Not all timeframes on all symbols are created equal. Make sure to scroll to the left and verify that your current chart timeframe isn't throwing out tons of bad signals. This will be easy to spot as it show up as constant rapid flipping from buy to sell.
Market Conditions: Performs best in trending markets. The flat threshold setting helps filter out poor performance during strong sideways action, but no indicator is perfect.
Confirmation: Wait for confirmed BUY/SELL signals rather than acting on immediate trend flips for better risk-adjusted returns.
Key Parameters
Alerts
The indicator provides two alert types:
These alerts fire only on confirmed signals, not on immediate price crossovers, providing higher-quality notifications.
Innovation Summary
This indicator advances trend-following methodology by introducing adaptive baseline calculation, intelligent signal confirmation, and comprehensive visual feedback systems. The combination of LHAMA adaptation, slope-based confirmation, and multi-layered risk management tools creates a more sophisticated approach to trend analysis than traditional supertrend indicators.
The result is a tool that maintains responsiveness during trending conditions while providing stability during consolidation, with clear visual cues for entry, exit, and risk management decisions.
Overview
The LHAMA Supertrend is an innovative trend-following indicator that combines adaptive moving average technology with intelligent signal confirmation. Unlike traditional supertrend indicators that rely on simple moving averages, this system uses my Low-High Adaptive Moving Average (🦙 LHAMA) algorithm that dynamically adjusts to market volatility and price action patterns. It is much more responsive to sudden price changes than traditional supertrend indicators, allowing you to jump in earlier and catch more of the move, and it manages this responsiveness without significantly increasing the number of false signals.
What Makes This Original
This indicator introduces several unique concepts not found in standard trend-following tools:
LHAMA Algorithm: The core innovation is the Low-High Adaptive Moving Average, which adapts its responsiveness based on the frequency of new highs and lows within a lookback period. This creates a more intelligent baseline that responds appropriately to different market conditions.
Delayed Confirmation System: Rather than generating immediate signals on price crossovers, the indicator implements a sophisticated confirmation mechanism using slope analysis. Signals are only triggered when both trend direction and momentum align, significantly reducing false signals.
Volume Integration: Optional volume weighting enhances the adaptive calculation, giving more weight to price movements during high-volume periods.
Daily Reset Functionality: Unique daily reset feature helps realign the indicator after overnight gaps, particularly useful for equity markets.
How It Works
LHAMA Calculation
The LHAMA baseline adapts using a coefficient derived from:
- Frequency of new highs and lows in the lookback period
- Optional volume weighting factor
- Smoothed adaptation rate based on market activity
The calculation:
lhama = previous_lhama + momentum_adaptation * (price - previous_lhama)
Where the momentum adaptation increases when markets are making new highs or lows, allowing faster response during trending conditions while providing stability during consolidation.
Signal Generation
The indicator uses a two-stage signal process:
- Trend Identification: Price position relative to LHAMA determines basic trend bias
- Slope Confirmation: ATR-normalized slope analysis confirms momentum direction
- Signal Timing: Buy/sell signals only trigger when trend direction and slope momentum align
Visual Components
LHAMA Line: The adaptive baseline with optional angle-based gradient coloring that visualizes momentum strength
Trend Clouds: Dynamic fill areas that adapt to the last confirmed signal direction
ATR Halo: Opposite-side ATR band providing optional additional context for stop-loss placement
Confirmation Signals: Clear BUY/SELL labels only appear after full confirmation
How to Use
Basic Setup
- Apply to any timeframe and symbol
- Default LHAMA length of 15 periods works well for most applications
- Accuracy depends greatly on chart timeframe and symbol, so make sure to backtest before relying on any signals. For example, ES and NQ work best on the 15m timeframe while GC and CL work best on the 5m.
- Enable daily reset for equity markets to handle overnight gaps
Signal Interpretation
- Immediate Heads-up: Small triangles show instant trend changes for awareness. These are your warnings to get ready to buy or sell if price takes off. (If many triangles are being printed in both directions, that is a warning that the market is ranging and you should not blindly follow a BUY/SELL signal without additional confirmation.)
- Confirmed Signals: BUY/SELL labels appear only after slope confirms the direction
- Cloud Color: Locked to the last confirmed signal direction for clear regime identification
Advanced Features
- Flat Threshold: Adjust the angle threshold to filter out sideways market noise
- Gradient Mode: Toggle between classic supertrend coloring and momentum-based gradients
- ATR Halo: Use the opposite-side cloud as a more generous trailing stop level
Risk Management
The indicator provides multiple levels for stop-loss placement:
- Tight: Edge of the main trend cloud
- Standard: The LHAMA Line itself
- Generous: ATR halo boundary
Best Practices
Timeframe Selection: Not all timeframes on all symbols are created equal. Make sure to scroll to the left and verify that your current chart timeframe isn't throwing out tons of bad signals. This will be easy to spot as it show up as constant rapid flipping from buy to sell.
Market Conditions: Performs best in trending markets. The flat threshold setting helps filter out poor performance during strong sideways action, but no indicator is perfect.
Confirmation: Wait for confirmed BUY/SELL signals rather than acting on immediate trend flips for better risk-adjusted returns.
Key Parameters
- LHAMA Length (15): Controls the lookback period for adaptive calculation
- Daily Reset: Helps maintain accuracy across overnight gaps
- Flat Threshold (5°): Filters out low-momentum signals
- Volume Weighting: Enhances adaptation during high-volume periods
Alerts
The indicator provides two alert types:
- "BUY (confirmed)": Triggers when bullish trend and upward slope align
- "SELL (confirmed)": Triggers when bearish trend and downward slope align
These alerts fire only on confirmed signals, not on immediate price crossovers, providing higher-quality notifications.
Innovation Summary
This indicator advances trend-following methodology by introducing adaptive baseline calculation, intelligent signal confirmation, and comprehensive visual feedback systems. The combination of LHAMA adaptation, slope-based confirmation, and multi-layered risk management tools creates a more sophisticated approach to trend analysis than traditional supertrend indicators.
The result is a tool that maintains responsiveness during trending conditions while providing stability during consolidation, with clear visual cues for entry, exit, and risk management decisions.
發行說明
Added a dashboard for quick reference.發行說明
Several small bug fixes. Added volume projection and candle volume shading.僅限邀請腳本
只有經作者批准的使用者才能訪問此腳本。您需要申請並獲得使用權限。該權限通常在付款後授予。如欲了解更多詳情,請依照以下作者的說明操作,或直接聯絡LHAMA-Trading。
除非您完全信任其作者並了解腳本的工作原理,否則TradingView不建議您付費或使用腳本。您也可以在我們的社群腳本中找到免費的開源替代方案。
作者的說明
This indicator is part of the LHAMA Trading Suite. See https://lhamatrading.com/
Creators of the LHAMA Trading Suite. Visit lhamatrading.com to unlock all our indicators.
Skip the drama, ride the LHAMA!
Skip the drama, ride the LHAMA!
免責聲明
這些資訊和出版物並不意味著也不構成TradingView提供或認可的金融、投資、交易或其他類型的意見或建議。請在使用條款閱讀更多資訊。
僅限邀請腳本
只有經作者批准的使用者才能訪問此腳本。您需要申請並獲得使用權限。該權限通常在付款後授予。如欲了解更多詳情,請依照以下作者的說明操作,或直接聯絡LHAMA-Trading。
除非您完全信任其作者並了解腳本的工作原理,否則TradingView不建議您付費或使用腳本。您也可以在我們的社群腳本中找到免費的開源替代方案。
作者的說明
This indicator is part of the LHAMA Trading Suite. See https://lhamatrading.com/
Creators of the LHAMA Trading Suite. Visit lhamatrading.com to unlock all our indicators.
Skip the drama, ride the LHAMA!
Skip the drama, ride the LHAMA!
免責聲明
這些資訊和出版物並不意味著也不構成TradingView提供或認可的金融、投資、交易或其他類型的意見或建議。請在使用條款閱讀更多資訊。