OPEN-SOURCE SCRIPT
Whalemap [BigBeluga]
The Whalemap indicator aims to spot big buying and selling activity represented as big orders for a possible bottom or top formation on the chart.
🔶 CALCULATION
The indicator uses volume to spot big volume activity represented as big orders in the market.
Pine Script®
When volume exceeds its own threshold, it is a sign that volume is exceeding its normal value and is considered as a "Whale order" or "Whale activity," which is then plotted on the chart as circles.
🔶 DETAILS

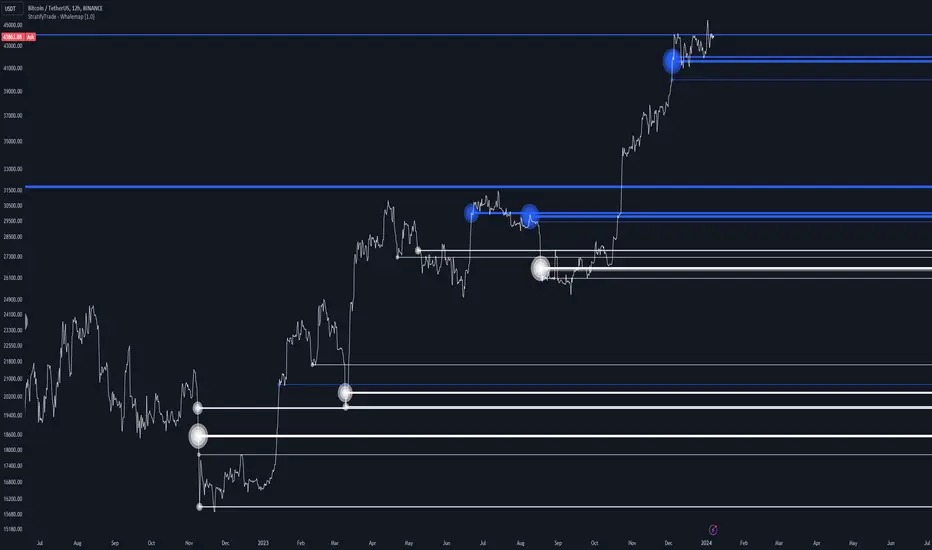
The indicator plots Bubbles on the chart with different sizes indicating the buying or selling activity. The bigger the circle, the more impact it will have on the market.
On each circle is also plotted a line, and its own weight is also determined by the strength of its own circle; the bigger the circle, the bigger the line.

Old buying/selling activity can also be used for future support and resistance to spot interesting areas.
The more price enters old buying/selling activity and starts producing orders of the same direction, it might be an interesting point to take a closer look.
🔶 EXAMPLES


The chart above is showing us price reacting to big orders, finding good bottoms in price and good tops in confluence with old activity.
🔶 SETTINGS
Users will have the options to:
🔶 CALCULATION
The indicator uses volume to spot big volume activity represented as big orders in the market.
for i = 0 to len - 1
blV.vol += (close > close[i + 1] ? volume : 0)
brV.vol += (close < close[i + 1] ? volume : 0)
When volume exceeds its own threshold, it is a sign that volume is exceeding its normal value and is considered as a "Whale order" or "Whale activity," which is then plotted on the chart as circles.
🔶 DETAILS
The indicator plots Bubbles on the chart with different sizes indicating the buying or selling activity. The bigger the circle, the more impact it will have on the market.
On each circle is also plotted a line, and its own weight is also determined by the strength of its own circle; the bigger the circle, the bigger the line.
Old buying/selling activity can also be used for future support and resistance to spot interesting areas.
The more price enters old buying/selling activity and starts producing orders of the same direction, it might be an interesting point to take a closer look.
🔶 EXAMPLES
The chart above is showing us price reacting to big orders, finding good bottoms in price and good tops in confluence with old activity.
🔶 SETTINGS
Users will have the options to:
- Filter options to adjust buying and selling sensitivity.
- Display/Hide Lines
- Display/Hide Bubbles
- Choose which orders to display (from smallest to biggest)
開源腳本
秉持TradingView一貫精神,這個腳本的創作者將其設為開源,以便交易者檢視並驗證其功能。向作者致敬!您可以免費使用此腳本,但請注意,重新發佈代碼需遵守我們的社群規範。
🔵Gain access to our powerful tools : bigbeluga.com/tv
🔵Join our free discord for updates : bigbeluga.com/discord
All scripts & content provided by BigBeluga are for informational & educational purposes only.
🔵Join our free discord for updates : bigbeluga.com/discord
All scripts & content provided by BigBeluga are for informational & educational purposes only.
免責聲明
這些資訊和出版物並非旨在提供,也不構成TradingView提供或認可的任何形式的財務、投資、交易或其他類型的建議或推薦。請閱讀使用條款以了解更多資訊。