OPEN-SOURCE SCRIPT
Shannon Entropy V2
Version 2, Shannon Entropy
This update includes both a deadband (Plotting Optional) and PercentRank Indicating.
Here is a unique way of looking at your price & volume information. Utilize the calculated value of "Shannon Entropy". This is a measure of "surprise" in the data, the larger the move or deviation from the most probable value, the higher the new information gain. What I think is so interesting about this value, is the smoothness that it displays the information without using moving averages. There is a lot of meat on this bone to be incorporated in other scripts.
H = -sum(prob(i) * log_base2(prob(i)))
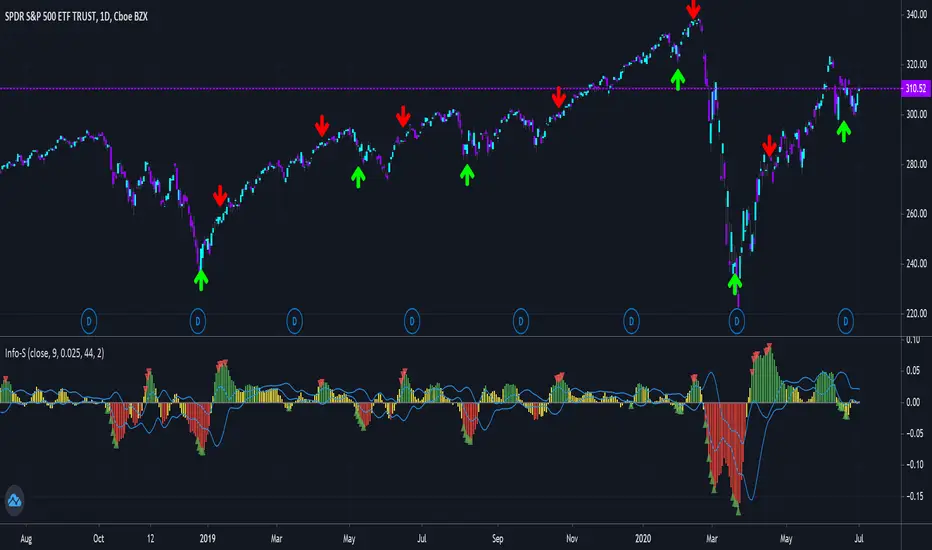
I've included the typical way that I've been experimenting with this, which is the difference between the volume information and price information. I've included the option to turn either price or volume data off to see the Shannon Entropy value of either value. There are a ton of complex scripts out there trying to do what this calculation is doing in 3 lines. As with anything, there are no free lunches, so you can nicely see as you lower the lengths you'll quickly learn where your nyquist frequencies are at, you'll want to work at about double the noisy value at a minimum.
Using this script is based on "Information" and it highlights places that need your attention, either because there is a large amount of change (new information) or there is minimal new information (complacency, institutional movements). Buy and Sell points are up to the user, this is just showing you where you need to provide some attention.
You can use it with or without volume data, you can also isolate either the source and volume. Below are some options for printing:

It can also with BTC (better with volume data)

Big shoutout to yatrader2 for great Shannon Entropy discussions.
And to Picte/ for his interesting inspiration STOCH-HVP-picte
This update includes both a deadband (Plotting Optional) and PercentRank Indicating.
Here is a unique way of looking at your price & volume information. Utilize the calculated value of "Shannon Entropy". This is a measure of "surprise" in the data, the larger the move or deviation from the most probable value, the higher the new information gain. What I think is so interesting about this value, is the smoothness that it displays the information without using moving averages. There is a lot of meat on this bone to be incorporated in other scripts.
H = -sum(prob(i) * log_base2(prob(i)))
I've included the typical way that I've been experimenting with this, which is the difference between the volume information and price information. I've included the option to turn either price or volume data off to see the Shannon Entropy value of either value. There are a ton of complex scripts out there trying to do what this calculation is doing in 3 lines. As with anything, there are no free lunches, so you can nicely see as you lower the lengths you'll quickly learn where your nyquist frequencies are at, you'll want to work at about double the noisy value at a minimum.
Using this script is based on "Information" and it highlights places that need your attention, either because there is a large amount of change (new information) or there is minimal new information (complacency, institutional movements). Buy and Sell points are up to the user, this is just showing you where you need to provide some attention.
You can use it with or without volume data, you can also isolate either the source and volume. Below are some options for printing:
It can also with BTC (better with volume data)
Big shoutout to yatrader2 for great Shannon Entropy discussions.
And to Picte/ for his interesting inspiration STOCH-HVP-picte
開源腳本
秉持TradingView一貫精神,這個腳本的創作者將其設為開源,以便交易者檢視並驗證其功能。向作者致敬!您可以免費使用此腳本,但請注意,重新發佈代碼需遵守我們的社群規範。
免責聲明
這些資訊和出版物並非旨在提供,也不構成TradingView提供或認可的任何形式的財務、投資、交易或其他類型的建議或推薦。請閱讀使用條款以了解更多資訊。
免責聲明
這些資訊和出版物並非旨在提供,也不構成TradingView提供或認可的任何形式的財務、投資、交易或其他類型的建議或推薦。請閱讀使用條款以了解更多資訊。