OPEN-SOURCE SCRIPT
Swing High/Low (ZigZag) [ChartPrime]

Swing High/Low (ZigZag) Indicator [ChartPrime]
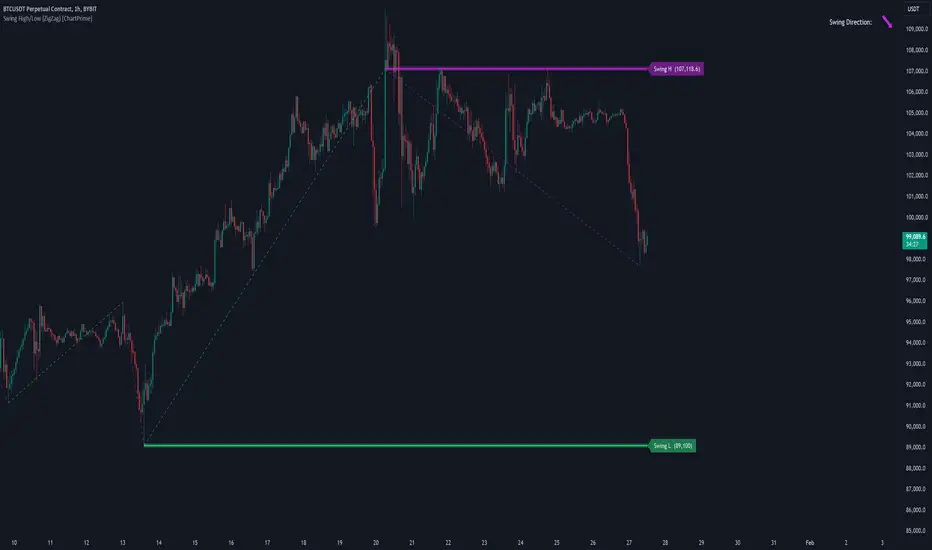
The Swing High/Low (ZigZag) Indicator [ChartPrime] is a versatile tool for identifying and visualizing price swings, swing highs, and swing lows. It dynamically plots levels for significant price points while connecting them with a ZigZag line, enabling traders to analyze market structure and trends with precision.
⯁ KEY FEATURES
⯁ HOW TO USE
⯁ CONCLUSION
The Swing High/Low (ZigZag) Indicator [ChartPrime] is a powerful tool for traders seeking to visualize price swings and market structure. Its real-time updates, customizable settings, and dynamic swing direction make it an invaluable resource for technical analysis and decision-making.
The Swing High/Low (ZigZag) Indicator [ChartPrime] is a versatile tool for identifying and visualizing price swings, swing highs, and swing lows. It dynamically plots levels for significant price points while connecting them with a ZigZag line, enabling traders to analyze market structure and trends with precision.
⯁ KEY FEATURES
- Swing Highs and Lows Detection
Accurately detects and marks swing highs and lows, providing a clear structure of market movements. - Real-Time ZigZag Line
Connects swing points with a dynamic ZigZag line for a visual representation of price trends. - Customizable Swing Sensitivity
Swing length input allows traders to adjust the sensitivity of swing detection to match their preferred market conditions. - Swing Levels with Shadows
Option to display swing levels with extended shadows for better visibility and market analysis. - Broken Levels Marking
Tracks and visually updates levels as dashed lines when broken, providing insights into shifts in market structure. - Swing Direction Display
At the top-right corner, the indicator displays the current swing direction (up or down) with a directional arrow for quick reference. - Interactive Labels
Marks swing levels with labels, showing the price of swing highs and lows for added clarity. - Dynamic Market Structure Analysis
Automatically adjusts ZigZag lines and levels as the market evolves, ensuring real-time updates for accurate trading decisions.
⯁ HOW TO USE
- Analyze Market Trends
Use the ZigZag line and swing levels to identify the overall direction and structure of the market. - Spot Significant Price Points
Swing highs and lows act as potential support and resistance levels for trading opportunities. - Adjust Swing Sensitivity
Modify the swing length setting to match your trading strategy, whether scalping, day trading, or swing trading. - Monitor Broken Levels
Use the dashed lines of broken levels to identify changes in market dynamics and potential breakout or breakdown zones. - Plan Entries and Exits
Leverage swing levels and direction to determine optimal entry, stop-loss, and take-profit points.
⯁ CONCLUSION
The Swing High/Low (ZigZag) Indicator [ChartPrime] is a powerful tool for traders seeking to visualize price swings and market structure. Its real-time updates, customizable settings, and dynamic swing direction make it an invaluable resource for technical analysis and decision-making.
開源腳本
秉持TradingView一貫精神,這個腳本的創作者將其設為開源,以便交易者檢視並驗證其功能。向作者致敬!您可以免費使用此腳本,但請注意,重新發佈代碼需遵守我們的社群規範。
免責聲明
這些資訊和出版物並非旨在提供,也不構成TradingView提供或認可的任何形式的財務、投資、交易或其他類型的建議或推薦。請閱讀使用條款以了解更多資訊。
開源腳本
秉持TradingView一貫精神,這個腳本的創作者將其設為開源,以便交易者檢視並驗證其功能。向作者致敬!您可以免費使用此腳本,但請注意,重新發佈代碼需遵守我們的社群規範。
免責聲明
這些資訊和出版物並非旨在提供,也不構成TradingView提供或認可的任何形式的財務、投資、交易或其他類型的建議或推薦。請閱讀使用條款以了解更多資訊。