PROTECTED SOURCE SCRIPT
Bollinger Bands + VWMA Signal
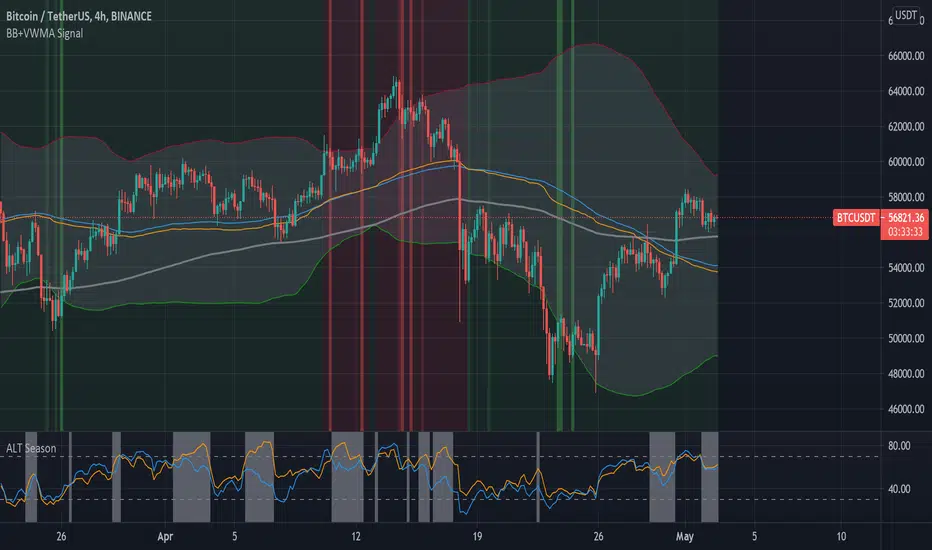
In this tool we can use Bollinger bands together with VWMA (volume weighted moving average) and Buy/Sell signals.
Red lines shows sell opportunities and green lines shows buy opportunities.
Sell and buy opportunities are deducted based on two moving average: (base MA) and VWMA.
This tool works in any time frames, but 4H is recommend.
The base moving average is set to 89 (in 4H) and you can change it to any values like (13, 21, 34, 55, 89, 144, ...).
The long(200) moving average can be used as a trend indicator, as well as support and resistance.
You may leave a like of you find it useful.
受保護腳本
此腳本以閉源形式發佈。 不過,您可以自由使用,沒有任何限制 — 點擊此處了解更多。
免責聲明
這些資訊和出版物並非旨在提供,也不構成TradingView提供或認可的任何形式的財務、投資、交易或其他類型的建議或推薦。請閱讀使用條款以了解更多資訊。
免責聲明
這些資訊和出版物並非旨在提供,也不構成TradingView提供或認可的任何形式的財務、投資、交易或其他類型的建議或推薦。請閱讀使用條款以了解更多資訊。