OPEN-SOURCE SCRIPT
已更新 Kijun-Sen Line
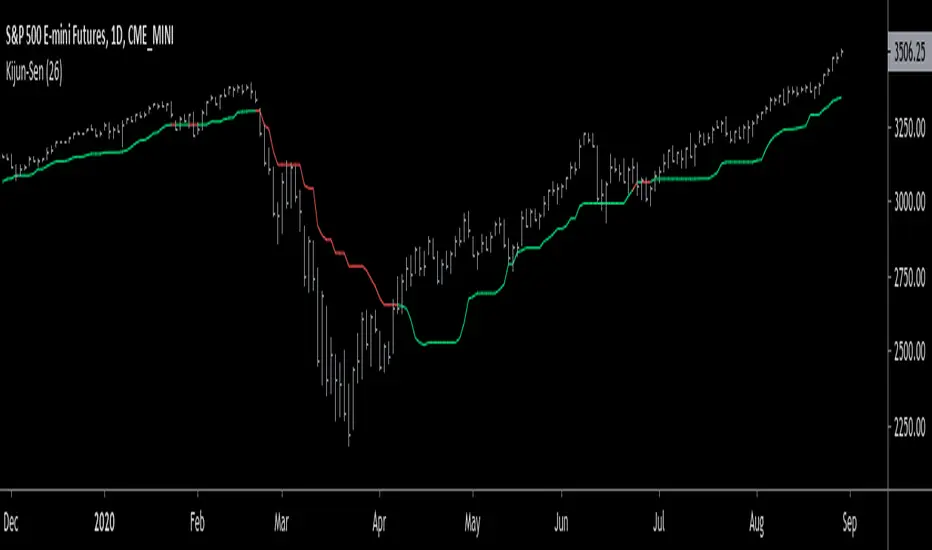
The Kijun-Sen line is an indicator that helps to identify the trend; whether that's up or down.
When the line is...
Green - Market is in an uptrend
Red - Market is in a downtrend
Recommended settings: 20 - 37 (26 is best)
The Kijun-Sen line, otherwise known as Baseline is simply the middle price between the highest high & the lowest low over a given period of time.
Calculation: (Highest high + lowest low)/2 = Baseline (Kijun-Sen)
The Kijun-Sen line was developed by Japanese journalist, Goichi Hosoda in the late 1960s. It was part of an indicator called the Ichimoku Cloud, an entire trend-trading system developed by the journalist himself. In my opinion, the Kijun-Sen is the most important part of the system.
Special thanks to VP & his Nononsense Forex Youtube Channel!
發行說明
>>>Chg green to lime.
開源腳本
秉持TradingView一貫精神,這個腳本的創作者將其設為開源,以便交易者檢視並驗證其功能。向作者致敬!您可以免費使用此腳本,但請注意,重新發佈代碼需遵守我們的社群規範。
免責聲明
這些資訊和出版物並非旨在提供,也不構成TradingView提供或認可的任何形式的財務、投資、交易或其他類型的建議或推薦。請閱讀使用條款以了解更多資訊。
免責聲明
這些資訊和出版物並非旨在提供,也不構成TradingView提供或認可的任何形式的財務、投資、交易或其他類型的建議或推薦。請閱讀使用條款以了解更多資訊。