OPEN-SOURCE SCRIPT
已更新 Day First Candle Breakout
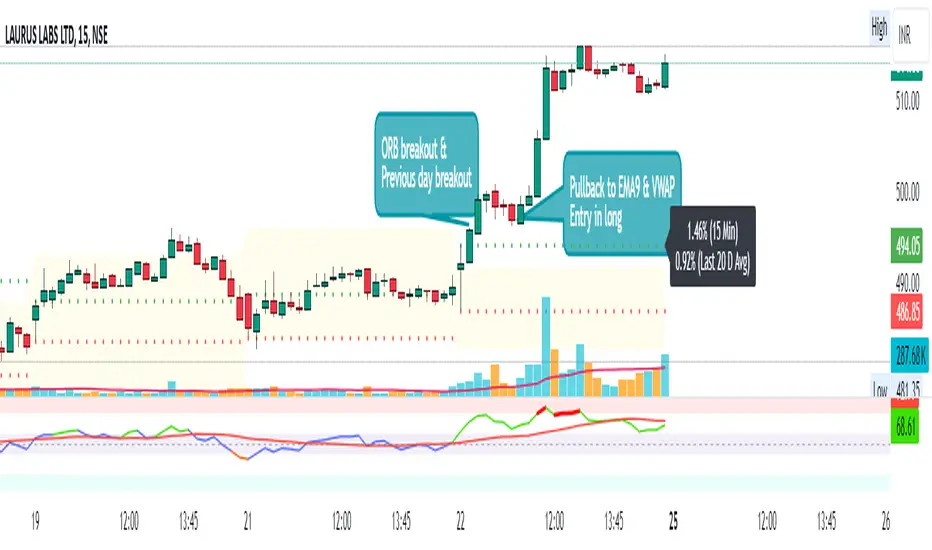
R-DFCB V1.5: Day First Candle Breakout
This indicator identifies potential breakout opportunities based on the first candle of the trading day. It considers the high and low of the initial trading range to determine possible entry points, along with the previous day's high and low to gauge the strength of the trend.
Key Features:
Day First Candle Breakout: Analyzes the first candle of the trading day to identify potential breakout scenarios.
Timeframe Selection: Allows users to select the timeframe for analyzing the first candle (e.g., 5, 15, or 60 minutes).
Previous Day and Week High/Low: Displays the high and low of the previous day and week to provide additional context for trading decisions.
Previous Day Trend Strength: Indicates whether the current price is above or below the previous day's high or low, signaling a stronger bullish or bearish trend respectively.
Trading Signals:
Buy Signal: Triggered when the price exceeds the high of the initial trading range after an upward price gap.
Sell Signal: Generated when the price falls below the low of the initial trading range after a downward price gap.
Trend Strength Analysis:
Strong Bullish Trend: If the current price is above the previous day's high, it indicates a stronger bullish trend.
Strong Bearish Trend: If the current price is below the previous day's low, it suggests a stronger bearish trend.
Caveats for Effective Trading:
Extended Trading Ranges: Adjusts support and resistance levels if the initial trading range extends beyond the defined timeframe.
Morning Noise Consideration: Exercises caution during volatile morning sessions to avoid false breakouts and whipsaws.
Pullbacks and Narrow Range Bars: Looks for opportunities during pullbacks or when the price forms narrow range bars to enter trades, reducing the risk of sudden reversals.
發行說明
Setting updated only開源腳本
秉持TradingView一貫精神,這個腳本的創作者將其設為開源,以便交易者檢視並驗證其功能。向作者致敬!您可以免費使用此腳本,但請注意,重新發佈代碼需遵守我們的社群規範。
免責聲明
這些資訊和出版物並非旨在提供,也不構成TradingView提供或認可的任何形式的財務、投資、交易或其他類型的建議或推薦。請閱讀使用條款以了解更多資訊。
免責聲明
這些資訊和出版物並非旨在提供,也不構成TradingView提供或認可的任何形式的財務、投資、交易或其他類型的建議或推薦。請閱讀使用條款以了解更多資訊。